Trump And Trudeau Twitter Analysis During COVID-19 Crisis Part 2

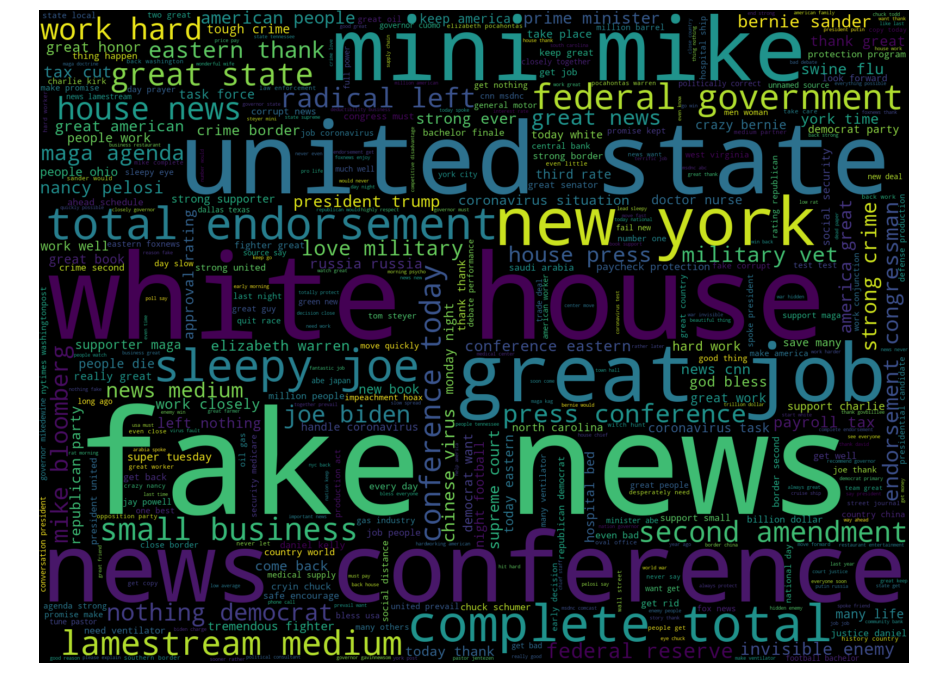
In our last post, we extract @realDonalTrump and @JustinTrudeau tweets, clean up the texts, and generate word clouds. In this article, we will build a Latent Dirichlet Allocation (LDA) model to study the topics of the hundreds of tweets posted by the two world leaders.

Topic Modeling

Topic modeling is an unsupervised machine learning technique which is widely used for discovering abstract topics of a collection of documents. It considers each document to be represented by several topics and each topic to be represented by a set of words that frequently appear together. For example, with a cluster of cloud, rain, wind, we can tell that the associated topic likely related to weather.

Trump And Trudeau Twitter Analysis During COVID-19 Crisis Part 1

During the COVID-19 pandemic, people take their worries, concerns, frustration, and loves to social media to share with the rest of the world about their feelings and thoughts. Twitter has become one of official channels where world leaders communicate with their supporters and followers. To understand what keep them busy, we extract tweets of two world leaders, Donald Trump (the President of United States) and Justin Trudeau (the Prime Minister of Canada). By applying natural language processing techniques and Latent Dirichlet Allocation (LDA) algorithm, topics of their tweets can be learned. So we can see what is on their mind during the crisis.

We use Python 3.6 and the following packages:

  • TwitterScraper, a Python script to scrape for tweets
  • NLTK (Natural Language Toolkit), a NLP package for text processing, e.g. stop words, punctuation, tokenization, lemmatization, etc.
  • Gensim, “generate similar”, a popular NLP package for topic modeling
  • Latent Dirichlet Allocation (LDA), a generative, probabilistic model for topic clustering/modeling
  • pyLDAvis, an interactive LDA visualization package, designed to help interpret topics in a topic model that is trained on a corpus of text data

Who Are the Top HR Analytics Influencers on Twitter

Visualizing Twitter social network of HRanalytics

Everyday people use social media such as Twitter to share thoughts and ideas. People with similar interests come together and interact on the online platform by re-sharing or replying posts they like. By studying how people interact on social networks, it will help us understand how information is distributed and identify who are the most prominent figures.

In our last post, we did a topic modeling study using Twitter feeds #HRTechConf and trained a model to learn the topics of all the tweets. In this article, we will analyze Twitter user interactions and visualize it in an interactive graph. 

Social Network is a network of social interactions and personal relationships. 

Oxford Dictionary

Auto Generated Insights of 2019 HR Tech Conference Twitter – Part 2 (Topic Modeling)

In our last post, we extract #HRTechConf tweets, clean up the texts, and generate a word cloud that highlights some of the buzzwords from the conference. But, what are the tweets talking about? Without reviewing each of the 7,000 tweets, how could we find out the popular topics? Let's explore and see if tweet topics could be auto detected by developing a Latent Dirichlet Allocation (LDA) model.

Feature Extraction

Tweets or any text must be converted to a vector of numbers - the dictionary that describes the occurrence of words in the text (or corpus). The technique we use is called Bag of Words, a simple method of extracting text features. Here are the steps.

Auto Generated Insights of 2019 HR Tech Conference Twitter – Part 1 (Word Cloud)

HR Technology Conference and Expo, world's leading and largest conference for HR and IT professionals, just took place in Las Vegas, from Oct 1 - 4, 2019. An incredibly amount of HR technology topics were covered at the conference. Unfortunately not everyone could be there, including myself. Is it possible to tell what the buzzwords and topics are without being there? The answer is YES! I dig into Twitter for some quick insights.

I scrape tweets with #HRTechConf, and build Latent Dirichlet Allocation (LDA) model for auto detecting and interpreting topics in the tweets. Here is my pipeline:

  1. Data gathering - twitter scrape
  2. Data pre-processing
  3. Generating word cloud
  4. Train LDA model
  5. Visualizing topics

I use Python 3.6 and the following packages:

  • TwitterScraper, a Python script to scrape for tweets
  • NLTK (Natural Language Toolkit), a NLP package for text processing, e.g. stop words, punctuation, tokenization, lemmatization, etc.
  • Gensim, "generate similar", a popular NLP package for topic modeling
  • Latent Dirichlet Allocation (LDA), a generative, probabilistic model for topic clustering/modeling
  • pyLDAvis, an interactive LDA visualization package, designed to help interpret topics in a topic model that is trained on a corpus of text data

Things Employees Like and Dislike About Their Companies

I work in people analytics and have been wondering all the time what make employees feel great or bad about their companies. Is it money? Workload? Opportunities to grow? Or team around them? I know the answer depends on the company, but is there anything in common for companies that employees like or dislike the most?

I went to Glassdoor for help. Glassdoor is one of the world's largest growing job sites where employees anonymously review current or former employers. I did my studies based on the 6,000 companies that have an office in Vancouver, BC.

Web App For Border Crossing Wait Time Forecast – Part 2

Keywords: Web App, Flask, AJAX, API, AWS, Virtual Environment

Previously, I built the Flask web app that runs on my local machine for predicting border crossing wait time. This time I'll show how it gets deployed on AWS and becomes a public available web app.

Here is the link to web app http://35.164.32.109:5000/

There is a small change to my workflow. Instead of using Facebook Prophet, I changed to build an XGBoost model due to Prophet requirement of minimum 4GB memory. AWS free tier EC2 service only has 1GB memory.

Model is rebuilt daily using the new wait time records available from prior day, and makes forecasts for the next 7 days. The last 7 days records are held out for model validation and RMSE is used for model evaluation.

Web App For Border Crossing Wait Time Forecast – Part 1

Keywords: Facebook Prophet, Web App, Flask, AJAX, API, AWS

About a year ago I built a predictive model for predicting border crossing wait time. There were a lot of feature manipulation and parameter tweaking. Although results were encouraging, I always wanted to simplify the process and also make the model available for public use.

After spending two weekends researching and coding (as I have no prior knowledge of Prophet or Flask), here is the improved workflow:

  1. Retrieve border crossing wait time from Cascade Gateway API
  2. Build predictive model for future crossing using Python + Facebook Prophet
  3. Develop web app REST API using Flask, HTML, CSS, ajax
  4. Deploy web app on AWS
  5. Refresh data and re-build predictive model daily

Credit Card Fraud Detection Using SMOTE Technique

Outlier detection is is an interesting application of machine learning. The goal is to identify those useful data records that can accurately profile abnormal behavior of the system. However, in real life examples, such special data like fraud and spam takes very small percentage of overall data population, which imposes challenges for developing machine learning models.

In this experiment, we will examine Kaggle's Credit Card Fraud Detection dataset and develop predictive models to detect fraud transactions which accounts for only 0.172% of all transactions. To deal with the unbalanced dateset issue, we will first balance the classes of our training data by a resampling technique (SMOTE), and then build a Logistic Regression model by optimizing the average precision score.

We will build and train our model on Google Colab, a free Jupyter notebook environment that runs on Google cloud and gives free GPU! For more information on Colab, check Colab official page.

Organizational network analysis – an experimental study

In every organization, people build and rely on informally-built networks seeking for information, advice, and collaborations. Often the invisible people networks are different from the formal organization hierarchy. Uncovering the informal but effective networks and understanding how information in the organization flows become crucial and enormously valuable to organization leaders.

In this article, we will briefly explain what Organization Network Analysis (ONA) is about and how to effectively measure. A small sample dataset is used to demonstrate our ONA experiment and network graph.

This post is part of a series of people analytics experiments: