Visualizing Twitter social network of HRanalytics
Everyday people use social media such as Twitter to share thoughts and ideas. People with similar interests come together and interact on the online platform by re-sharing or replying posts they like. By studying how people interact on social networks, it will help us understand how information is distributed and identify who are the most prominent figures.
In our last post, we did a topic modeling study using Twitter feeds #HRTechConf and trained a model to learn the topics of all the tweets. In this article, we will analyze Twitter user interactions and visualize it in an interactive graph.
Social Network is a network of social interactions and personal relationships.
Oxford Dictionary
I use Python 3.6 and the following packages:
- Tweepy: a Python library for accessing Twitter API .
- NetworkX: a Python package for studying structure of complex networks .
- PyVis: a Python library for creating and visualizing interactive network graphs.
If you are interested in Organizational Network Analysis, check this article we wrote.
Data Gathering
We use Tweepy (a Python library for accessing Twitter API) to extract all tweets mentioning about HRanalytics. Only tweets posted from November 2 to 11, 2019 could be retrieved due to Twitter API limitation. Overall it has 333 tweets.
We consider there is a Twitter user interaction when a tweet is retweeted or replied, or a Twitter user gets mentioned in another user’s tweet. The idea is that someone has more influence on the topic of HRanalytics if their tweets or name appear more frequently in the network.
In the following retweet example, we consider there is an interaction between Twitter user Sonianasher and HRCurator.
RT @HRCurator: How Bosch Uses Gamification to Build #HRAnalytics Skills (Case Study) https://t.co/8IjyO1HdUe @DigitalHRTech @AnalyticsinHR…
Sonianasher
Graph Modeling
A social network e.g. Twitter graph consists of nodes and edges. Nodes are Twitter account, and edges are interactions between Twitter users.
Also, it is very likely that a Twitter user A has some influence on user B if B retweets, replies or mentions A’s tweet. Therefore, Twitter network is a directed graph. In the example above, user Sonianasher is not only connected with HRCurator but also is “influenced” by HRCurator ‘s tweet.
To construct our Twitter network, we use NetworkX, a Python package for studying structure of complex networks.
import networkx as nx
graph = nx.DiGraph()
All interactions in the 333 retrieved tweets are added to the directed graph. Let’s see how well our Twitter network is connected.
degrees = [(node, val) for (node, val) in graph.degree()]
degrees_df = pd.DataFrame(degrees, columns=['node', 'degree']).sort_values(
        by='degree',ascending=False)
degrees_df.head(10)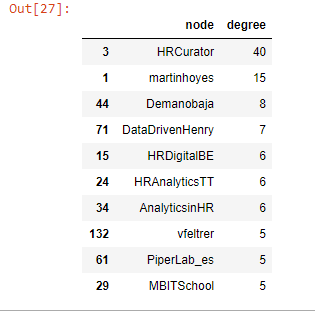
Twitter account HRCurator has most interactions (40) and martinhoyes has 15.
degrees_df.describe()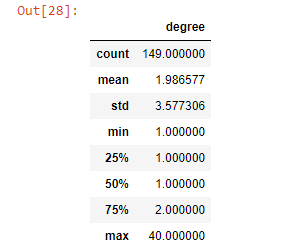
It has 149 nodes and over 50% nodes has only one connection. Maximum number of connections is 40 and average is 1.99. Are all nodes connected in one graph?
nx.number_connected_components(graph.to_undirected())22
Wow, we have 22 disconnected sub-graphs and that is not good. We are mostly interested in a large fully connected graph.
nodes = max(nx.connected_component_subgraphs(graph.to_undirected()), key=len)
largest_subgraph = graph.subgraph(nodes)
print(nx.info(largest_subgraph))
Name:
Type: DiGraph
Number of nodes: 84
Number of edges: 100
Average in degree: 1.1905
Average out degree: 1.1905
The largest sub-graph has 84 nodes and 100 edges. Let’s make sure all nodes are connected in this graph.
nx.number_connected_components(largest_subgraph.to_undirected())1
Great! It has only one connected graph.
Network Visualization
Now, we can plot our Twitter interaction network.
node_degree = largest_subgraph.degree()
pos = nx.spring_layout(largest_subgraph, k=0.4)
plt.figure(figsize=(18,16))
nx.draw(largest_subgraph, pos=pos,
        linewidths=0.2, node_color=range(len(node_degree)),
        node_size=60, alpha=0.6, with_labels=True)
nx.draw_networkx_nodes(largest_subgraph, pos=pos, node_size=10, alpha=0.3)
plt.show()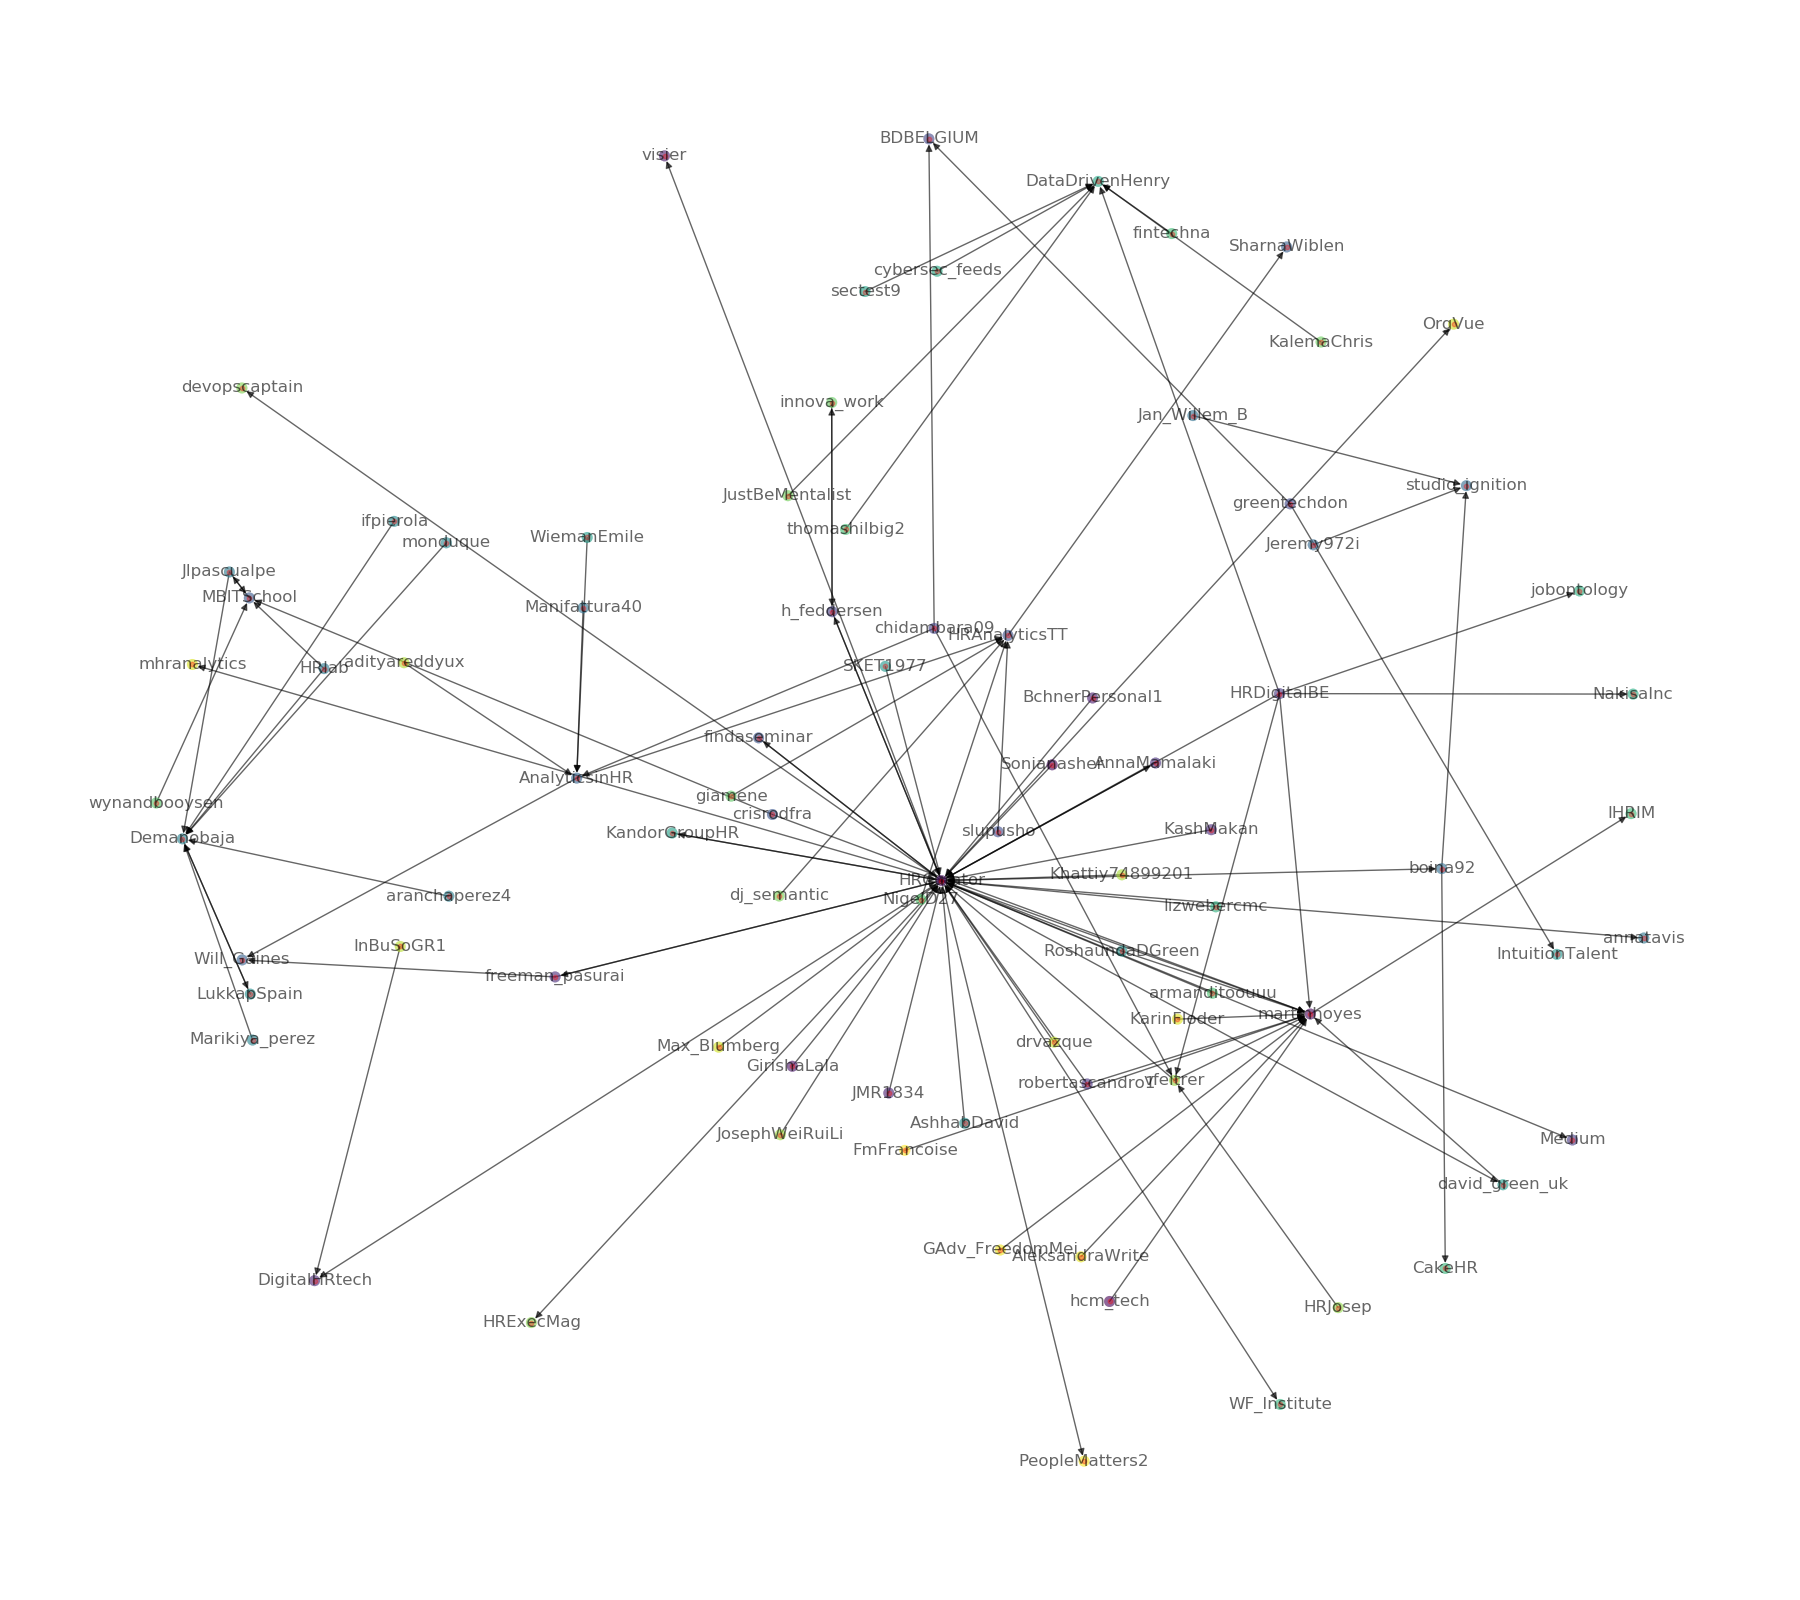
Same network in a circular layout.
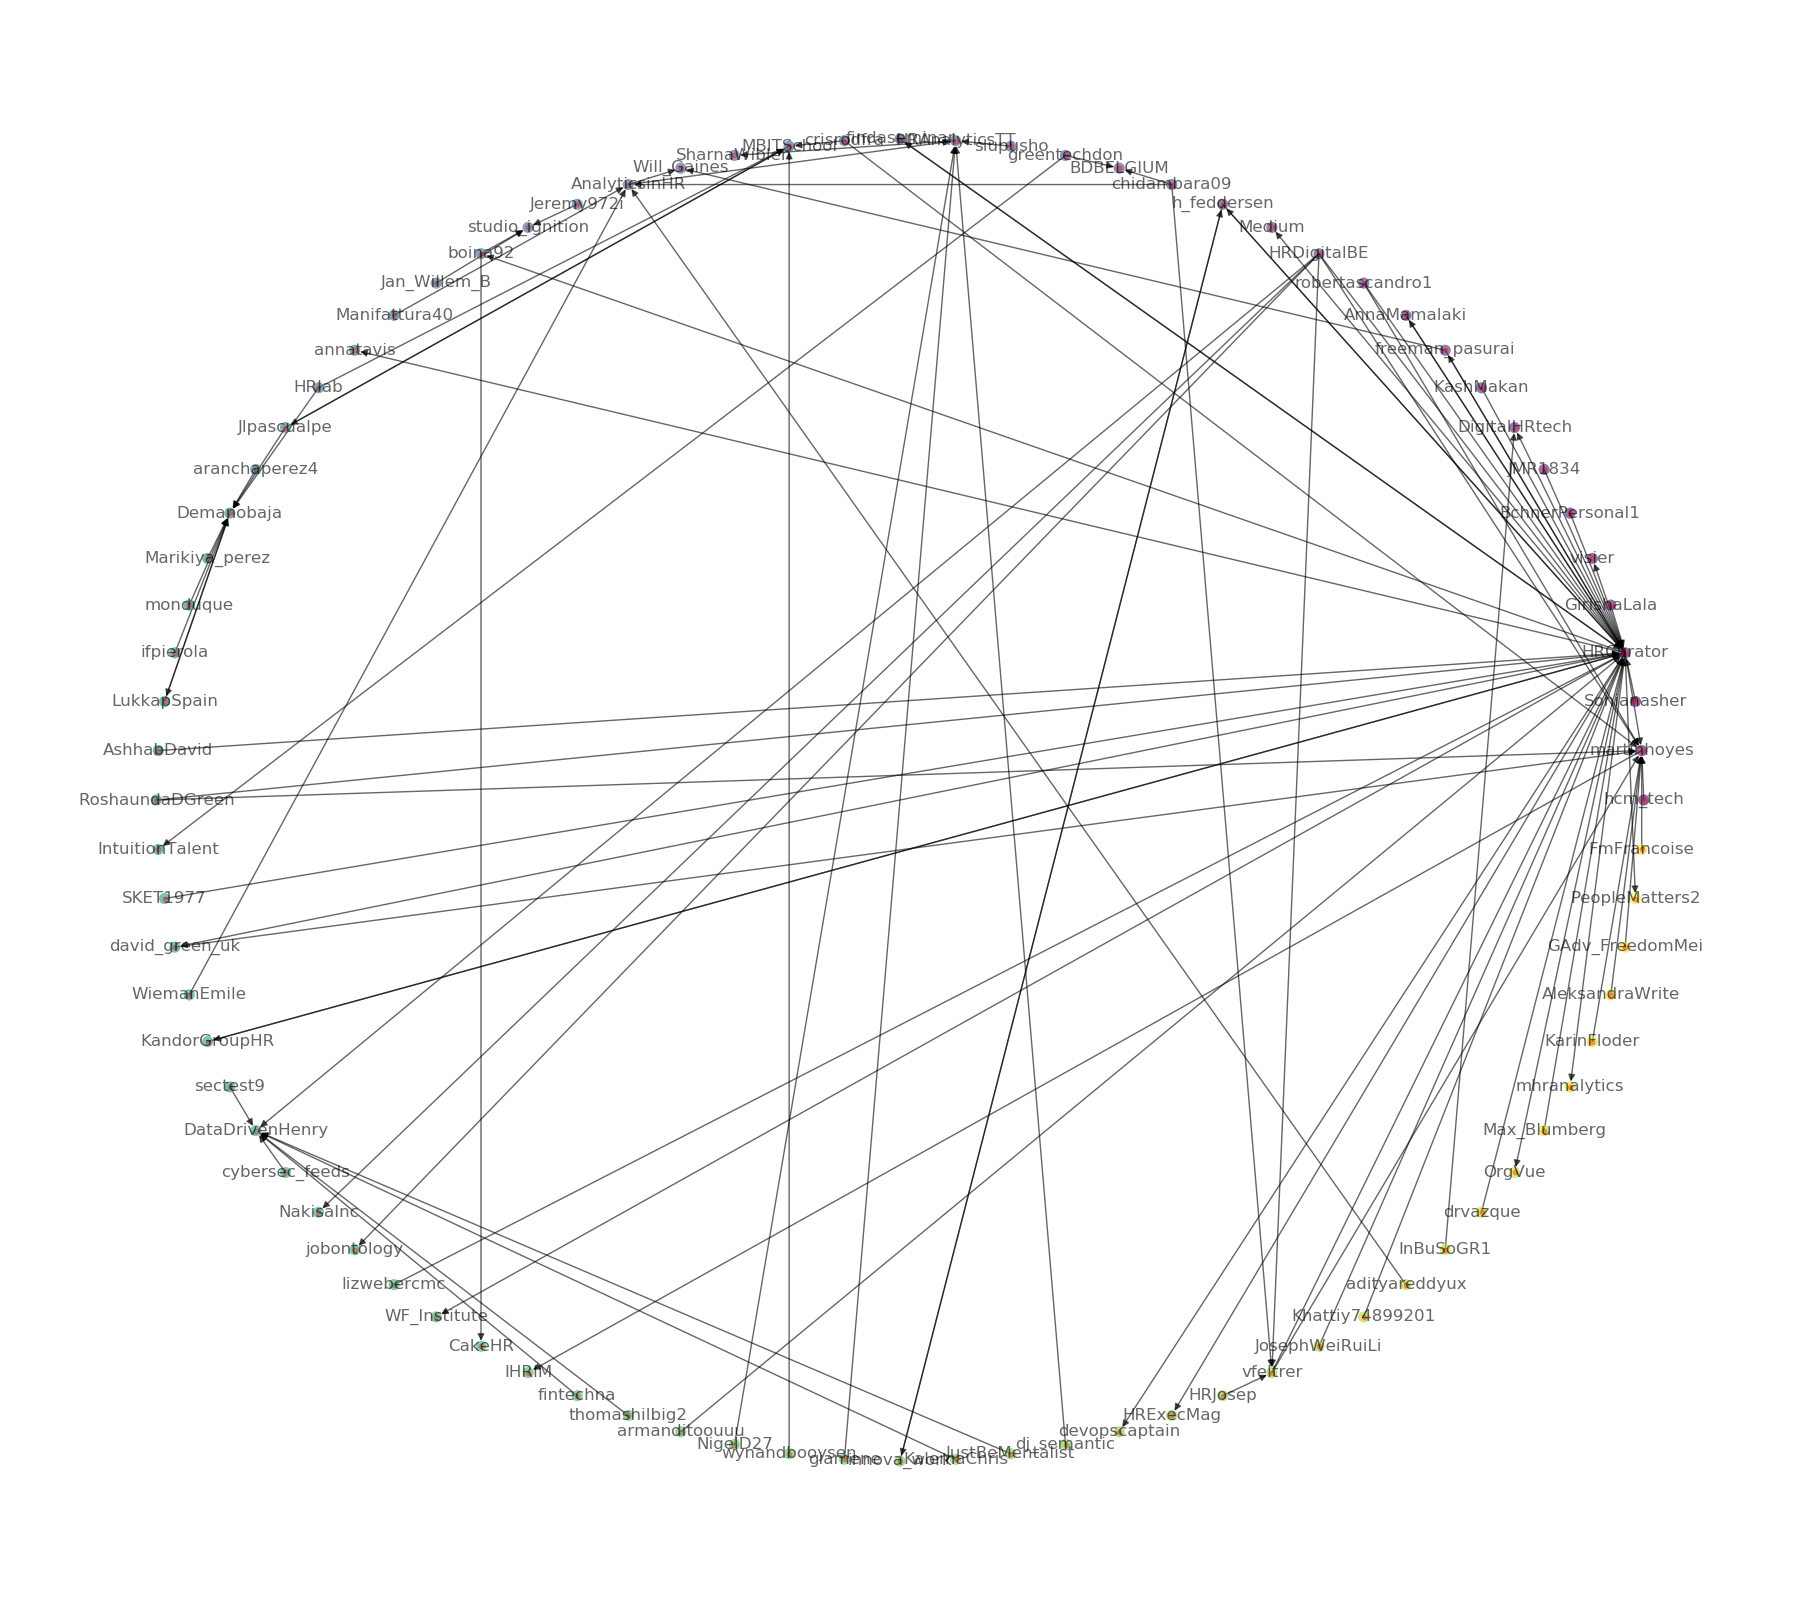
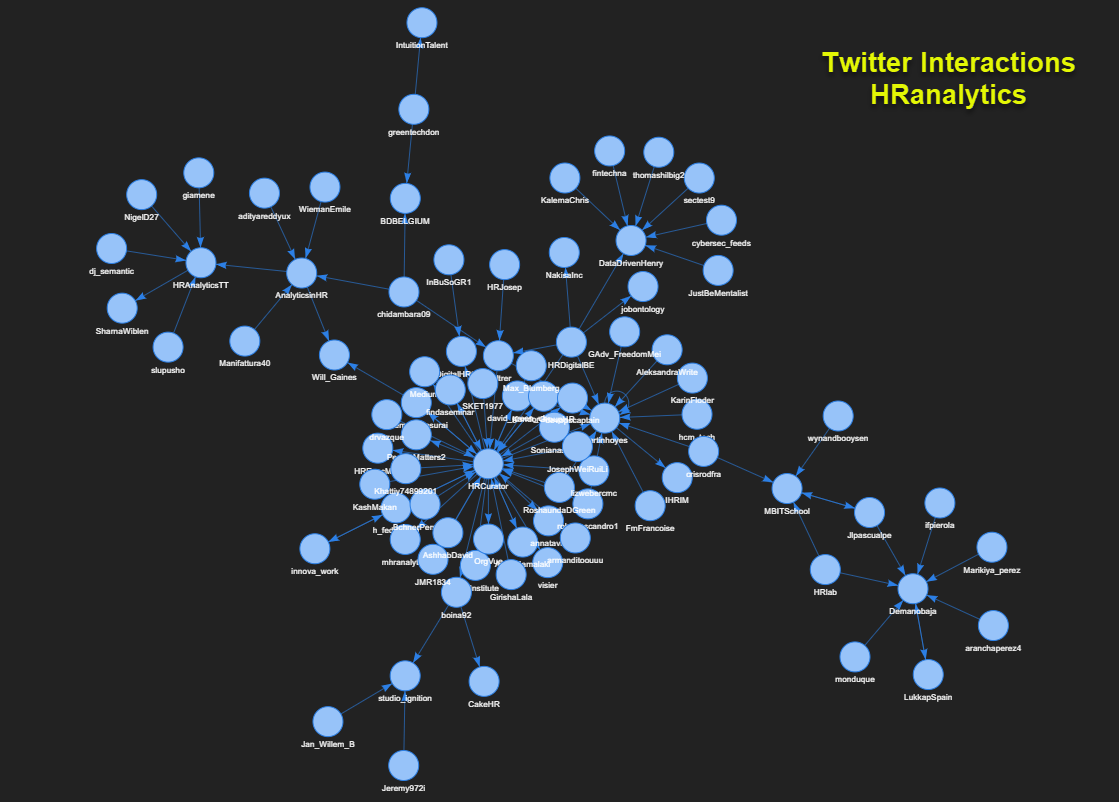
It appears that many arrows are pointing to node HRCurator and martinhoyes, which confirms what is discovered earlier in our analysis above that user HRCurator and martinhoyes have the most influence in this network.
It is cool but hard to visualize connections of each node. No worries. We use PyVis library to build an interactive web graph that allows user dragging, hovering, and selecting nodes and edges. Here is the link to the interactive graph web page.
from pyvis.network import Network
net = Network(height="850px", width="100%", bgcolor="#222222",
              font_color="white", directed=True)
net.from_nx(largest_subgraph)
net.show("interactive_graph.html")
Closing Notes
Social network such as Twitter has tremendous amount of information of human behavior and society. The advent of social networks enables studies of information distribution, influence propagation, and community structure. Graph analytics have proven to be valuable in discovering these insights from networks.
Happy Machine Learning!