Exploratory Spatial Data Analysis (ESDA) – Spatial Autocorrelation

In exploratory data analysis (EDA), we often calculate correlation coefficients and present the result in a heatmap. Correlation coefficient measures the statistical relationship between two variables. The correlation value represents how the change in one parameter would impact the other, e.g. quantity of purchase vs price. Correlation analysis is a very important concept in the field of predictive analytics before building the model.

But how do we measure statistical relationship in a spatial dataset with geo locations? The conventional EDA and correlation analysis ignores the location features and treats geo coordinates similar to other regular features. Exploratory Spatial Data Analysis (ESDA) becomes very useful in the analysis of location-based data.

Spatial Autocorrelation

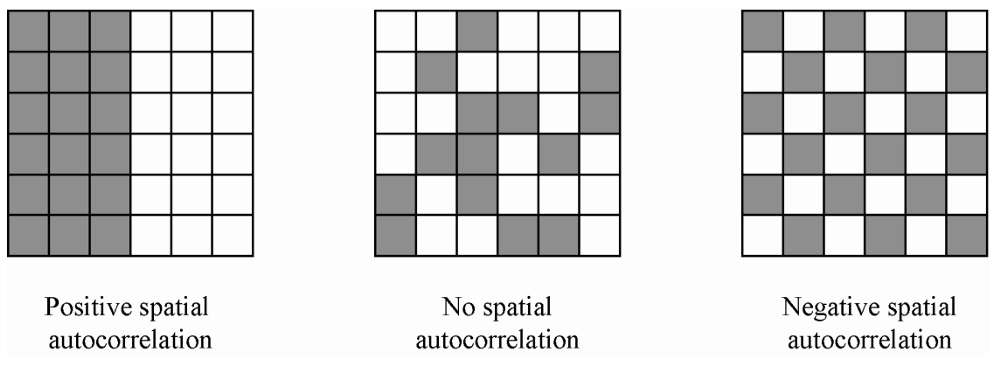
ESDA is intended to complement geovizualization through formal statistical tests for spatial clustering, and Spatial Autocorrelation is one of the important goals of those tests. Spatial autocorrelation measures the correlation of a variable across space i.e. relationships to neighbors on a graph. Values can be

  • positive: nearby cases are similar or clustered e.g. High-High or Low-Low (left image on the figure below)
  • neutral: neighbor cases have no particular relationship or random, absence of pattern (center image on the figure below)
  • negative: nearby cases are dissimilar or dispersed e.g. High-Low or Low-High (right image on the figure below)
Illustrations of spatial autocorrelation. From (Radil, 2011).

How many bikes to be shared in Vancouver NEXT WEEK – Part 1

Despite of worldwide debates on bike sharing benefits and challenges, Vancouver launched its own bike sharing program in summer 2016, Mobi sponsored by Shaw Go. First bike share appeared in Amsterdam in 1960's, and then was introduced to other big European cities. It has got popularized by the Chinese in the last decade - 13 out of 15 world biggest bike share programs are in China. I like bike share program because it is simply convenient and helps to save environment. So I decided to look into Vancouver bike share historical data, and hoped to find some trends/patterns. Thanks to Mobi who made their bike usage data available, predictive models can be built to forecast future rides. Quick summary of the project workflow: [caption id="attachment_539" align="alignnone" width="508"]Project workflow Project workflow[/caption]

How much time will it take to cross the border at Peace Arch?

Living in Vancouver, it is so convenient driving cross the border and have some fun on the other side. However, if you have headache of waiting in the long border-crossing lines and getting stuck for almost an hour, you are not alone. We all know the basic strategies on best/worst days/hours to cross, for example, avoid long weekend or Christmas week, arriving the border early, etc. A crystal ball that can tell us ahead of time on our wait time at the border crossing will be just fantastic! Well, I decided to give it a swing and make a crystal ball - to build a machine learning model. Below is a quick summary of the workflow on this mini project. [caption id="attachment_512" align="alignnone" width="544"] Project workflow[/caption]

Why so many wildfires in BC lately

[caption id="attachment_478" align="aligncenter" width="623"] Downtown Vancouver before and after hazy smokes caused by massive wildfires[/caption] British Columbia wildfires are burning out of control! There were a number of air quality warnings issued cross BC in summer 2018. Smoky air flew all the way to Alberta and even cross the border to US. It made me curious what's going on with BC wildfires and what the situation was used to be. Wildwire datasets for previous years and current year (updated in May 2018) were gathered from DataBC, data published by BC Wildfire Service. For relevance and clarity, data prior to 1980 is ignored.