Living in Vancouver, it is so convenient driving cross the border and have some fun on the other side. However, if you have headache of waiting in the long border-crossing lines and getting stuck for almost an hour, you are not alone. We all know the basic strategies on best/worst days/hours to cross, for example, avoid long weekend or Christmas week, arriving the border early, etc. A crystal ball that can tell us ahead of time on our wait time at the border crossing will be just fantastic! Well, I decided to give it a swing and make a crystal ball – to build a machine learning model.
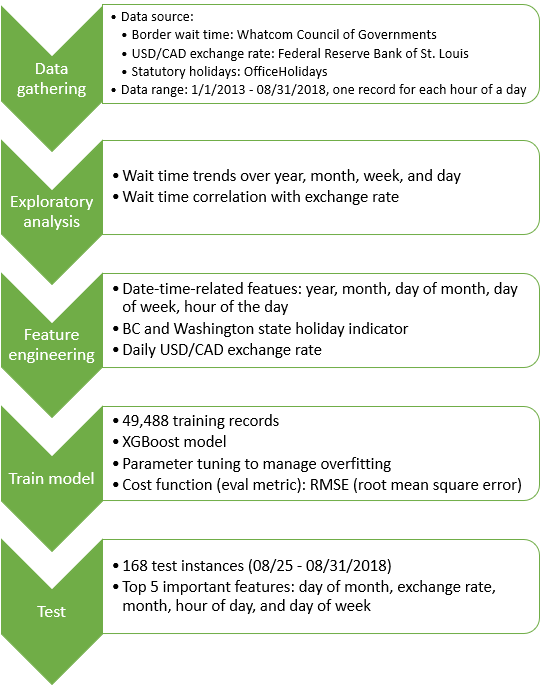
Below is a quick summary of the workflow on this mini project.
One thing to note: volume of car passing at the border could be used for prediction instead of wait time. Volume should be more predictable because it does not vary frequently due to border control changes, e.g. tougher security checks, number of lanes/posts open, and sometimes on-site constructions. However, from a commuter perspective, he/she is more interested in knowing time delays than total number of vehicles passing the border.
Python code can be found on my GitHub.
Prediction Preview
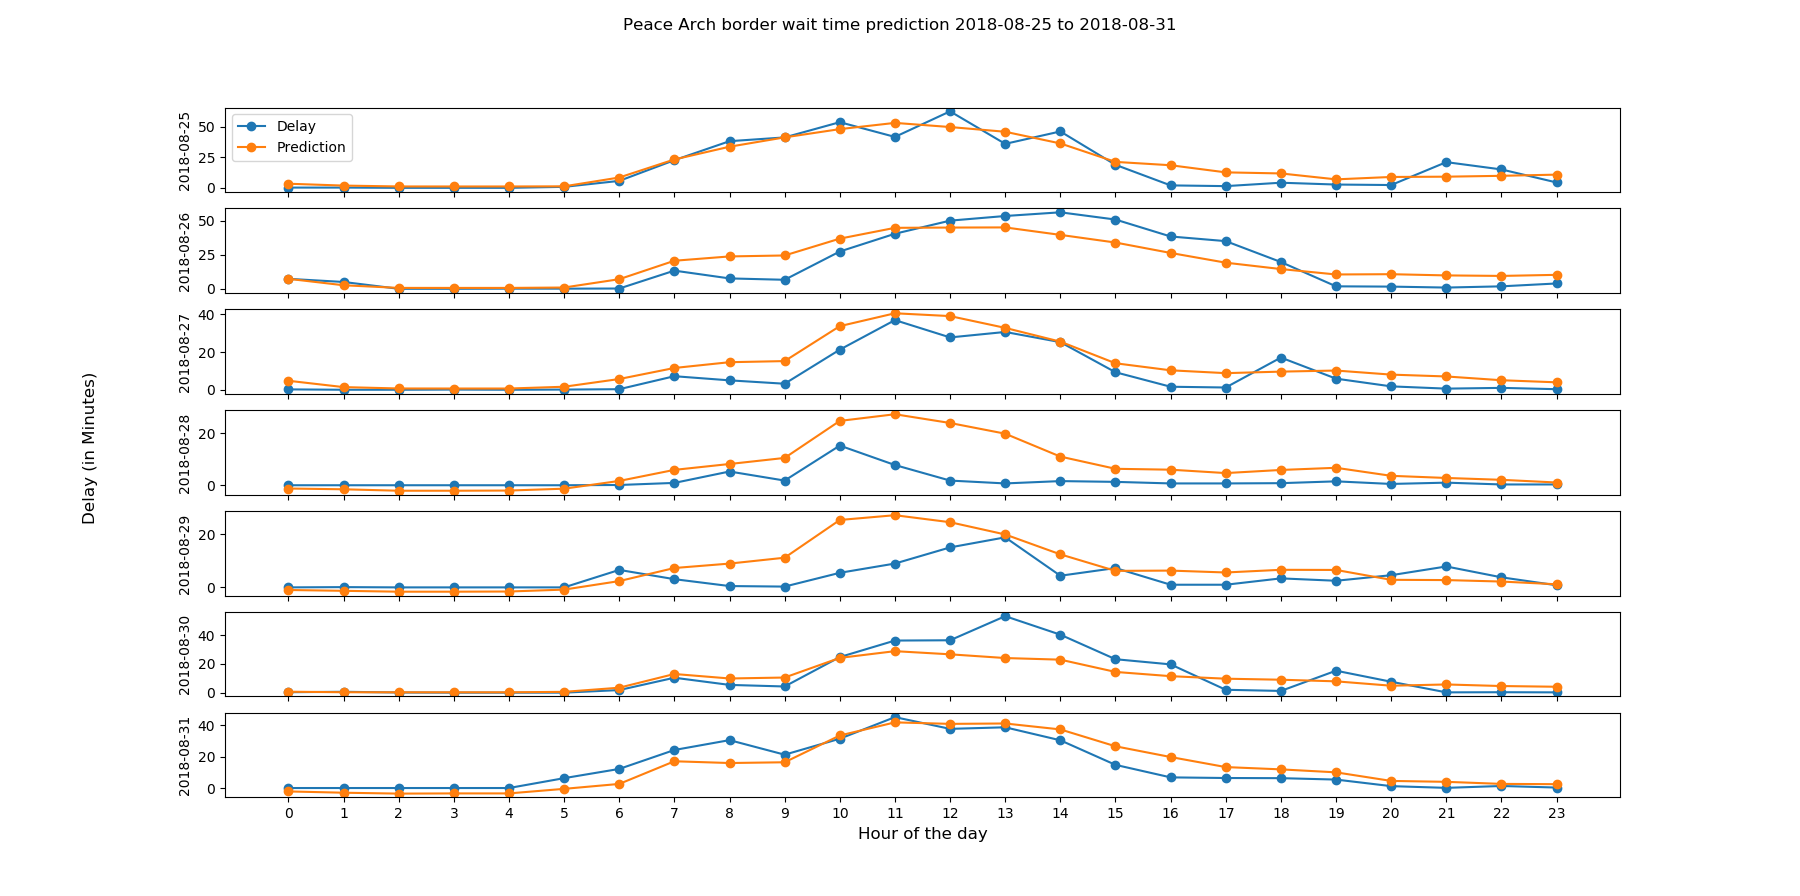
Before dive into implementation details, here is a short preview of the predictions that are made on the last week of August 2018 (08/25-08/31). Not too bad right? 🙂 At least it captures the hourly and daily trends.
Data Gathering
Data is collected from three different sources:
- Border wait time: Whatcom Council of Governments http://www.cascadegatewaydata.com/Crossing/
- USD/CAD exchange rate: Federal Reserve Bank of St. Louis https://fred.stlouisfed.org/series/DEXCAUS
- Statutory holidays: OfficeHolidays https://www.officeholidays.com/
Data of the northbound (entry to Canada) regular car passing at Peace Arch is used for the project. USD/CAD daily exchange rate is added as a feature because we Canadians are known for cross-border shopping when CAD is strong. Both BC and WA holidays are added to highlight extra delays at the border on holidays.
Exploratory Analysis
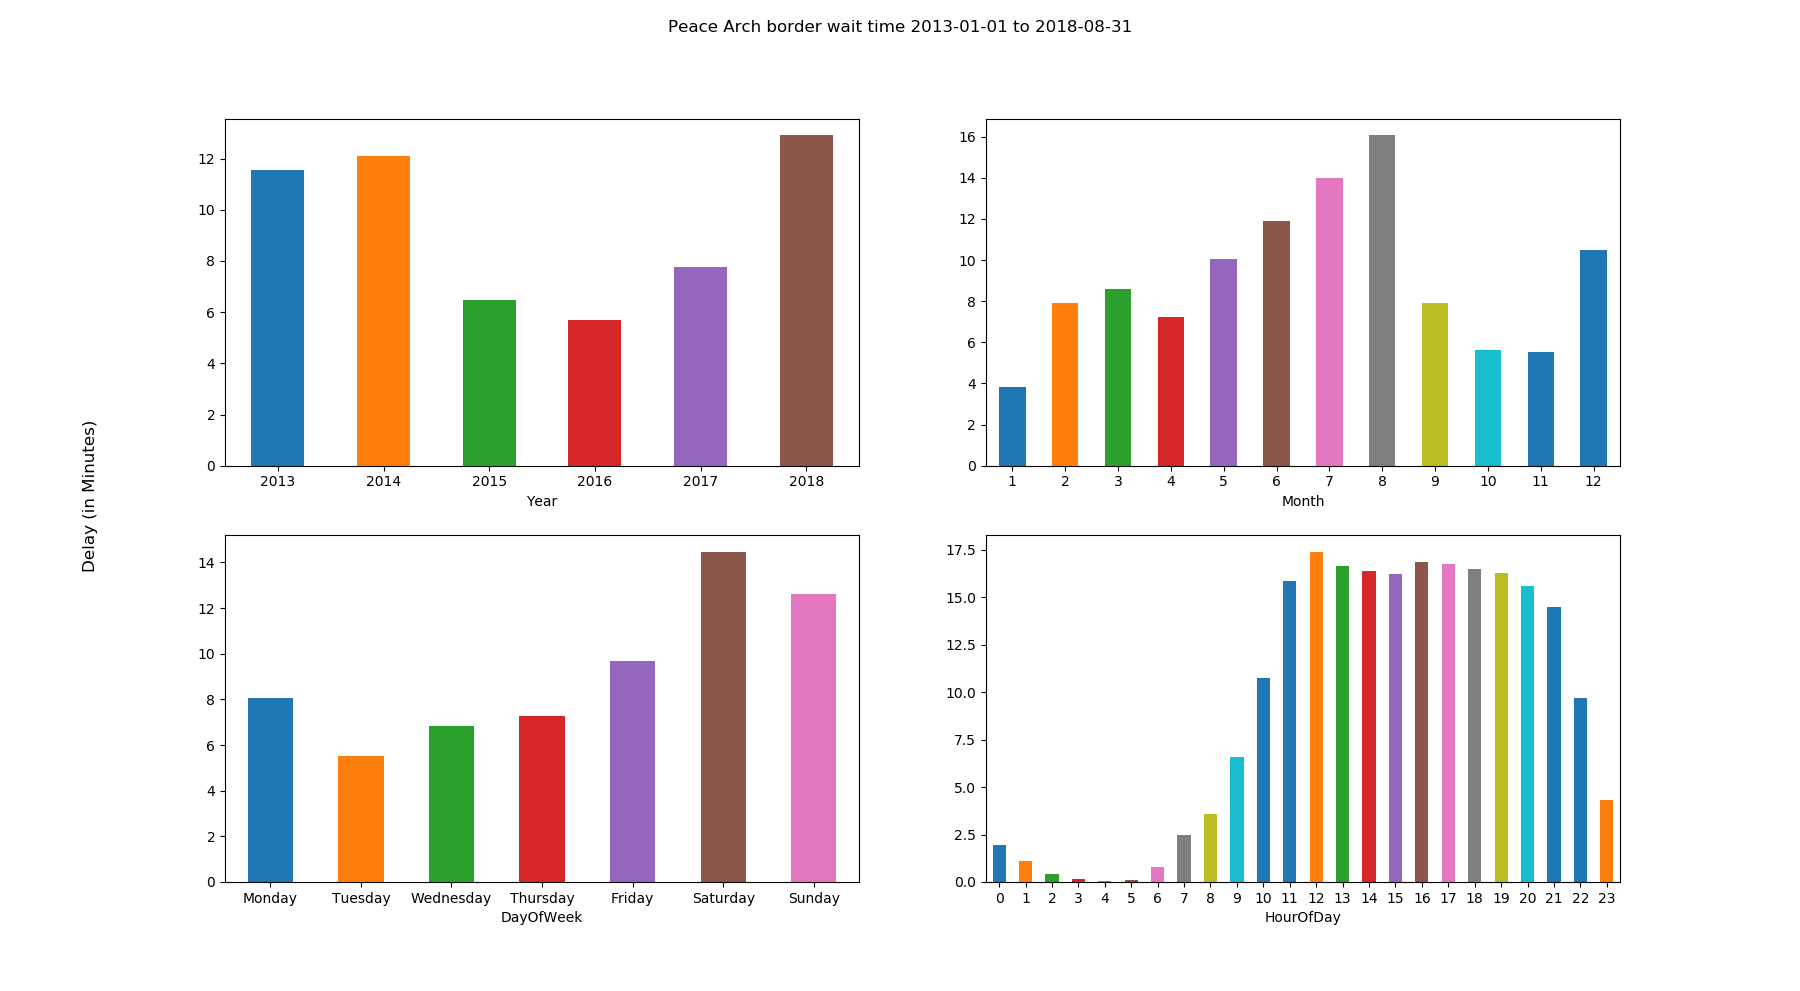
Some trends can be found from these charts:
- Delay at Peace Arch dropped significantly in 2015 and 2016, and started picking up again in 2017
- Summer months are the worst and most busy time crossing, followed by Christmas time.
- Longer delays are expected in general on weekends.
- Longest wait time during a day is from 10am to 10pm.
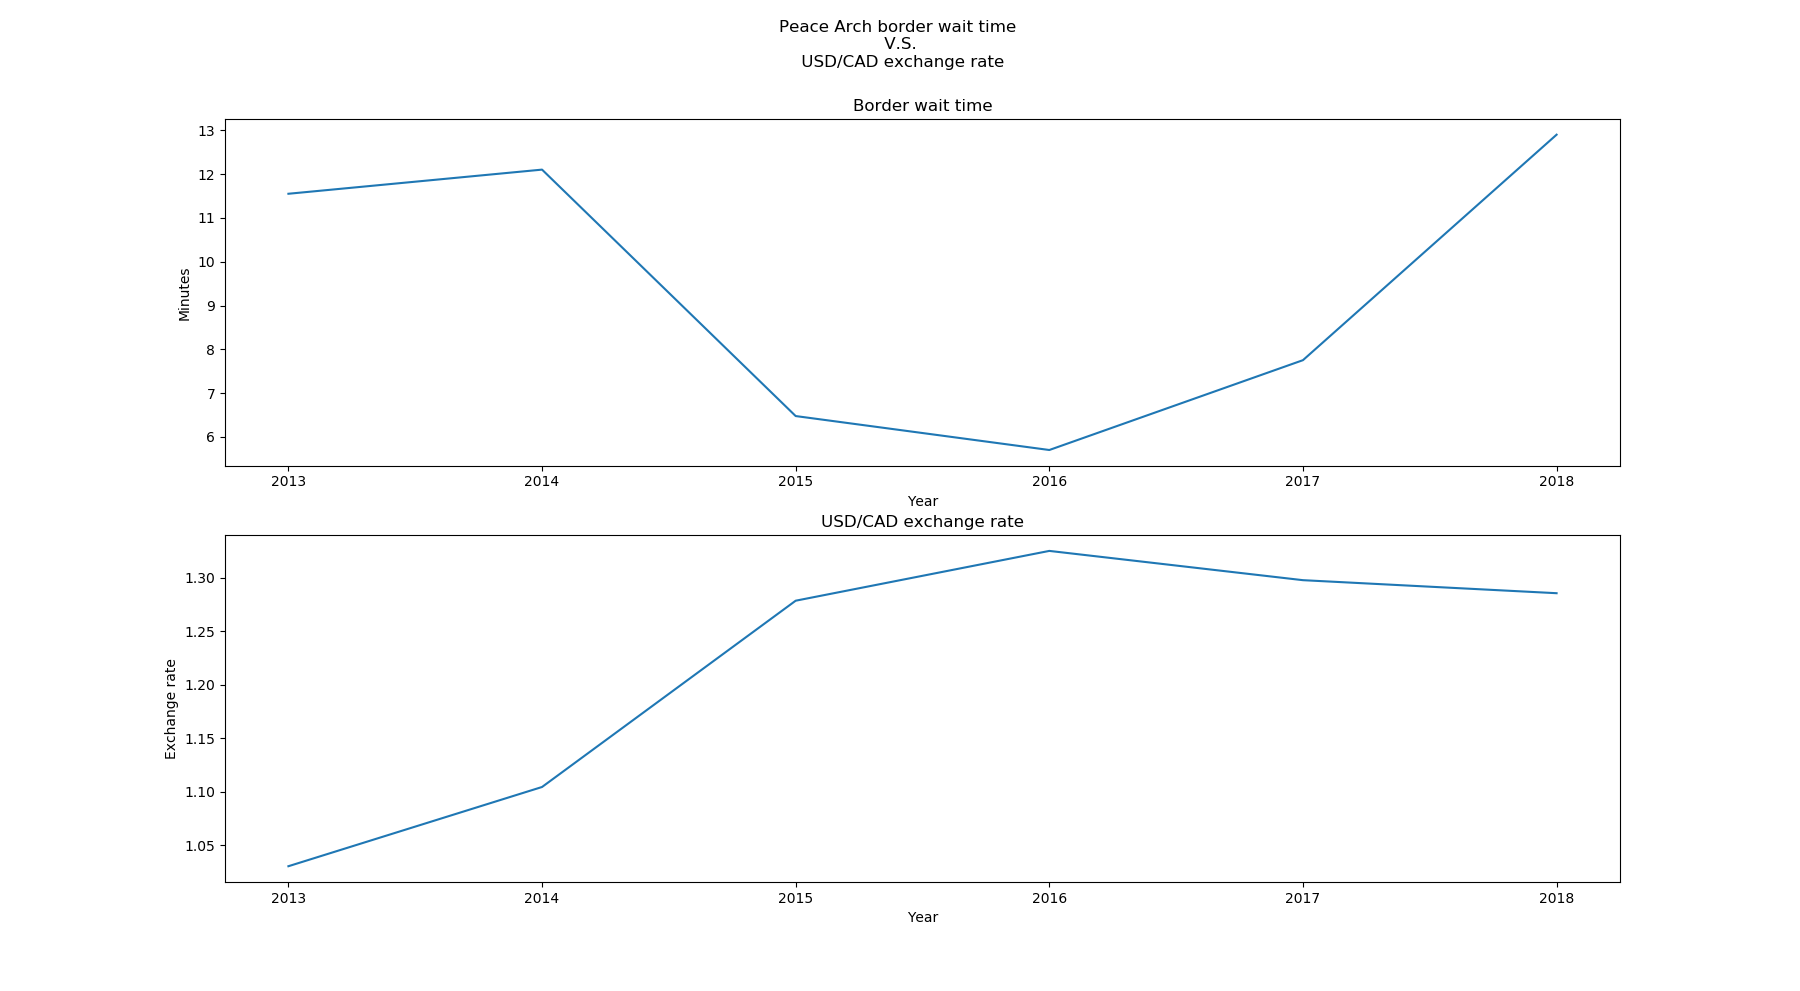
Above are trendlines of yearly average border wait time and exchange rate. They are almost opposite, that is, less delay at the border (fewer travellers) when CAD is weaker as in 2015 and 2016.
Train and Test
Hourly border wait times from 01/01/2013 to 08/24/2018 are used for training an XGBoost model. To manage overfitting, early stopping of 10 iterations is introduced, small numbers are given to model penalization parameters, and subsampling ratios are tuned. Model performance is evaluated on RMSE (root mean square error).
Model is tested on hourly delays from 08/25-08/31/2018. Training RMSE: 5.98, Test: 7.88.
Predictions on test are very close to real delays on daily and hourly bases. It is able to replicate the trendlines of peak and off-peak hours. Predictions on two weekend days (08/25 and 08/26) are even better.
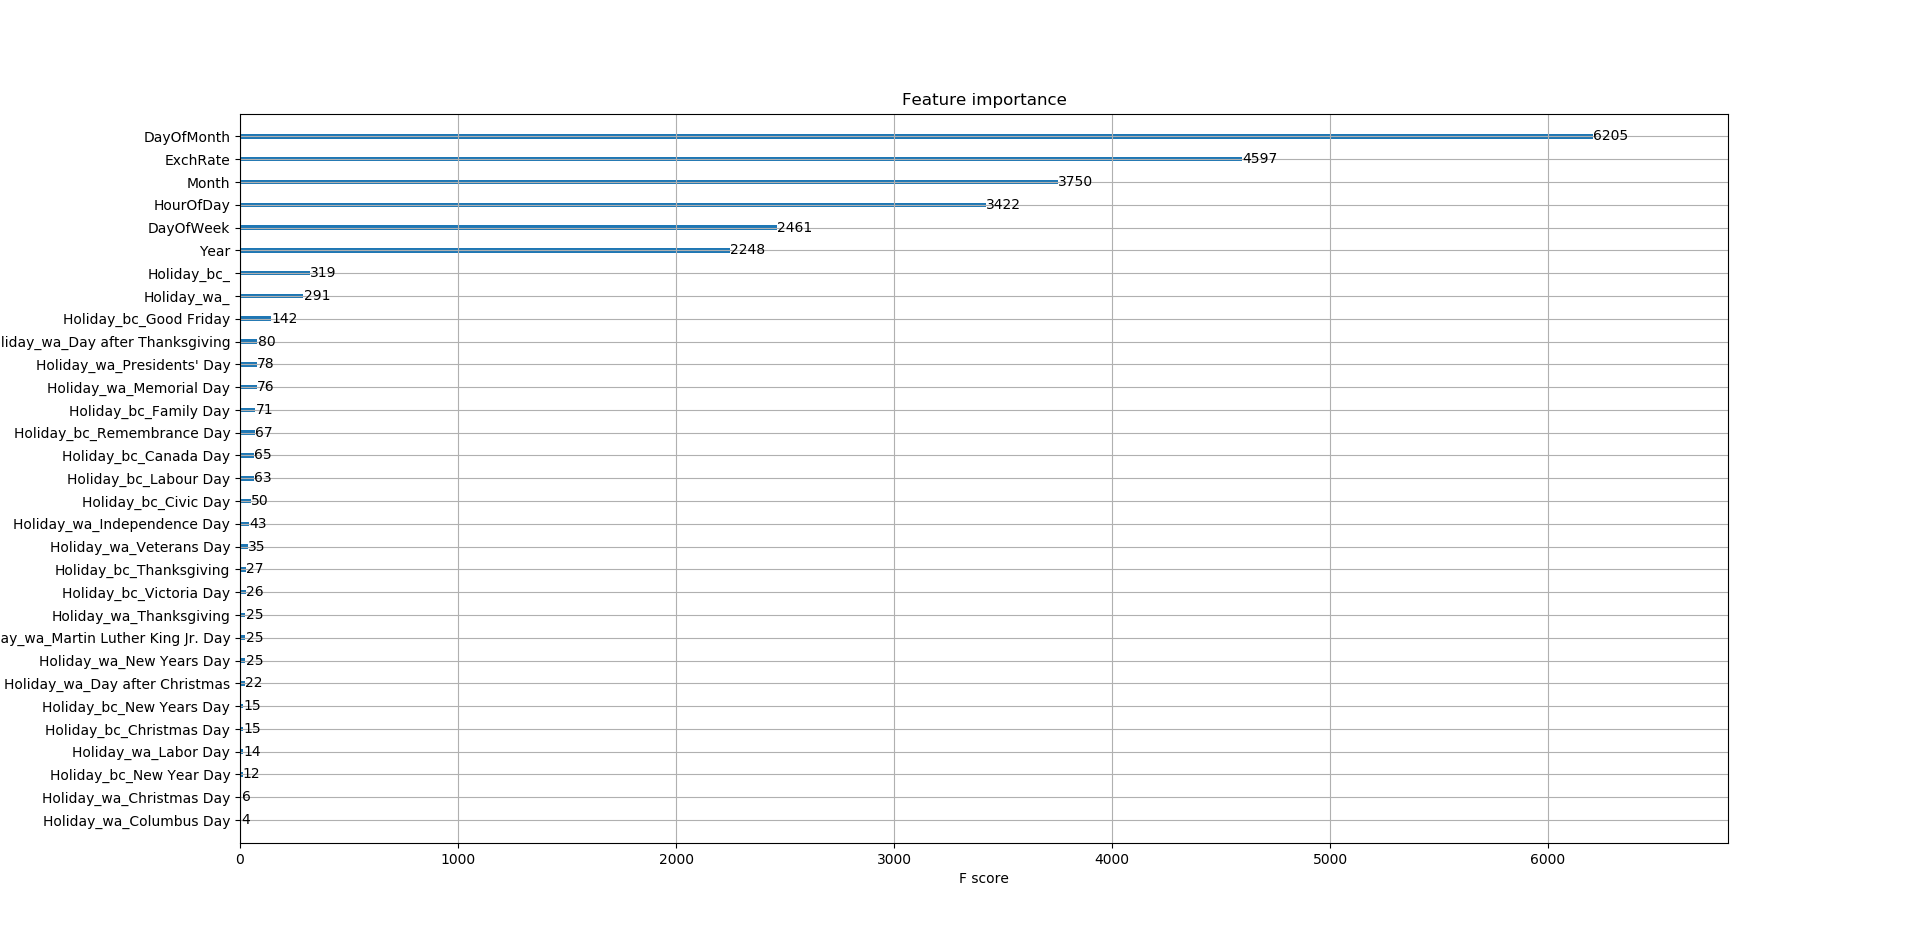
Top 5 important features: day of month, exchange rate, month, hour of day, and day of week
Future Work
- Could add more relevant features, e.g. weather info, gas price, etc.
- Rerun the model and predict wait times for 2018/09
- Set up a web-service page and people can use it to plan their future border crossing!
Python code can be found on my GitHub.