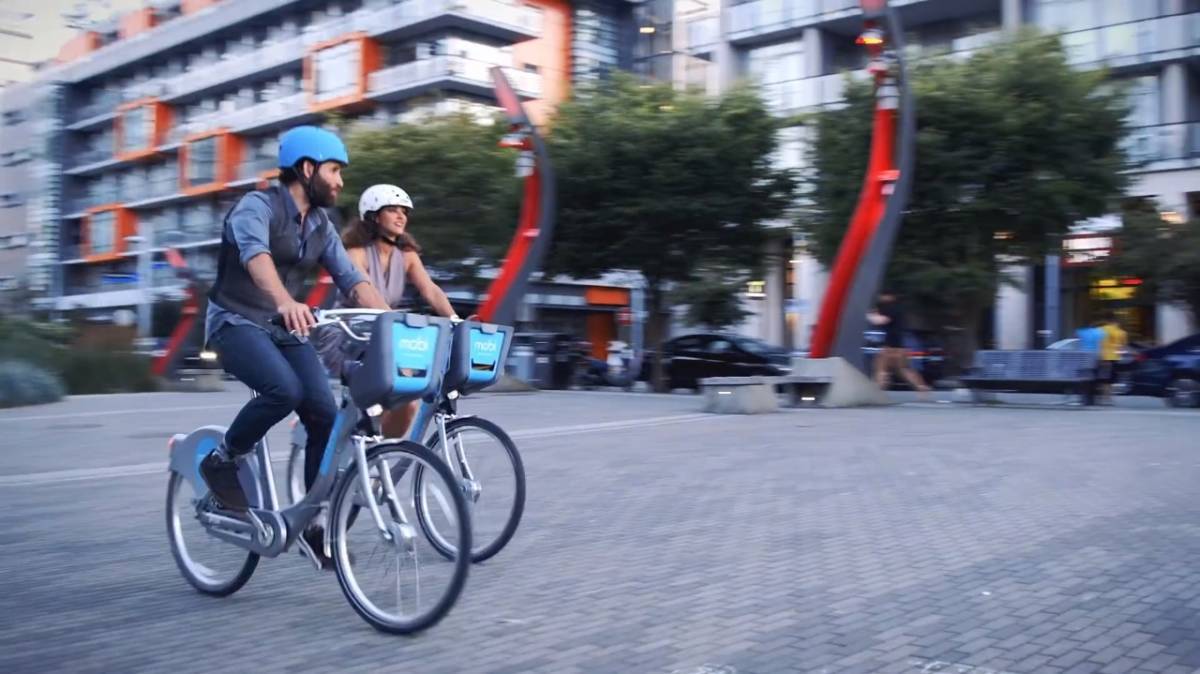
Despite of worldwide debates on bike sharing benefits and challenges, Vancouver launched its own bike sharing program in summer 2016, Mobi sponsored by Shaw Go. First bike share appeared in Amsterdam in 1960’s, and then was introduced to other big European cities. It has got popularized by the Chinese in the last decade – 13 out of 15 world biggest bike share programs are in China.
I like bike share program because it is simply convenient and helps to save environment. So I decided to look into Vancouver bike share historical data, and hoped to find some trends/patterns. Thanks to Mobi who made their bike usage data available, predictive models can be built to forecast future rides.
Quick summary of the project workflow:
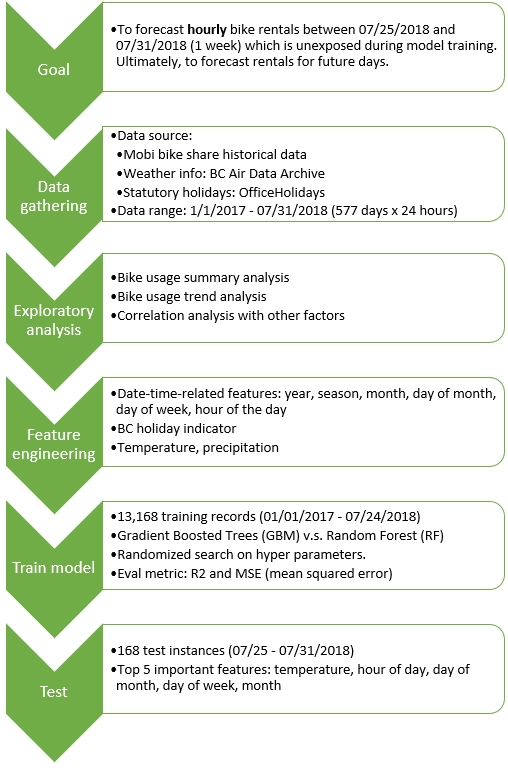
It is a long post and this is Part 1: historical data exploratory analysis. Part 2 will be on building machine learning models for forecast. Python code can be found on my GitHub.
Data Gathering
Data is collected from three different sources:
- Historical bike rental data from Mobi website
- Statutory holidays: OfficeHolidays
- Weather information from Air Data Archive by BC Government
Exploratory Analysis
Bike usage summary
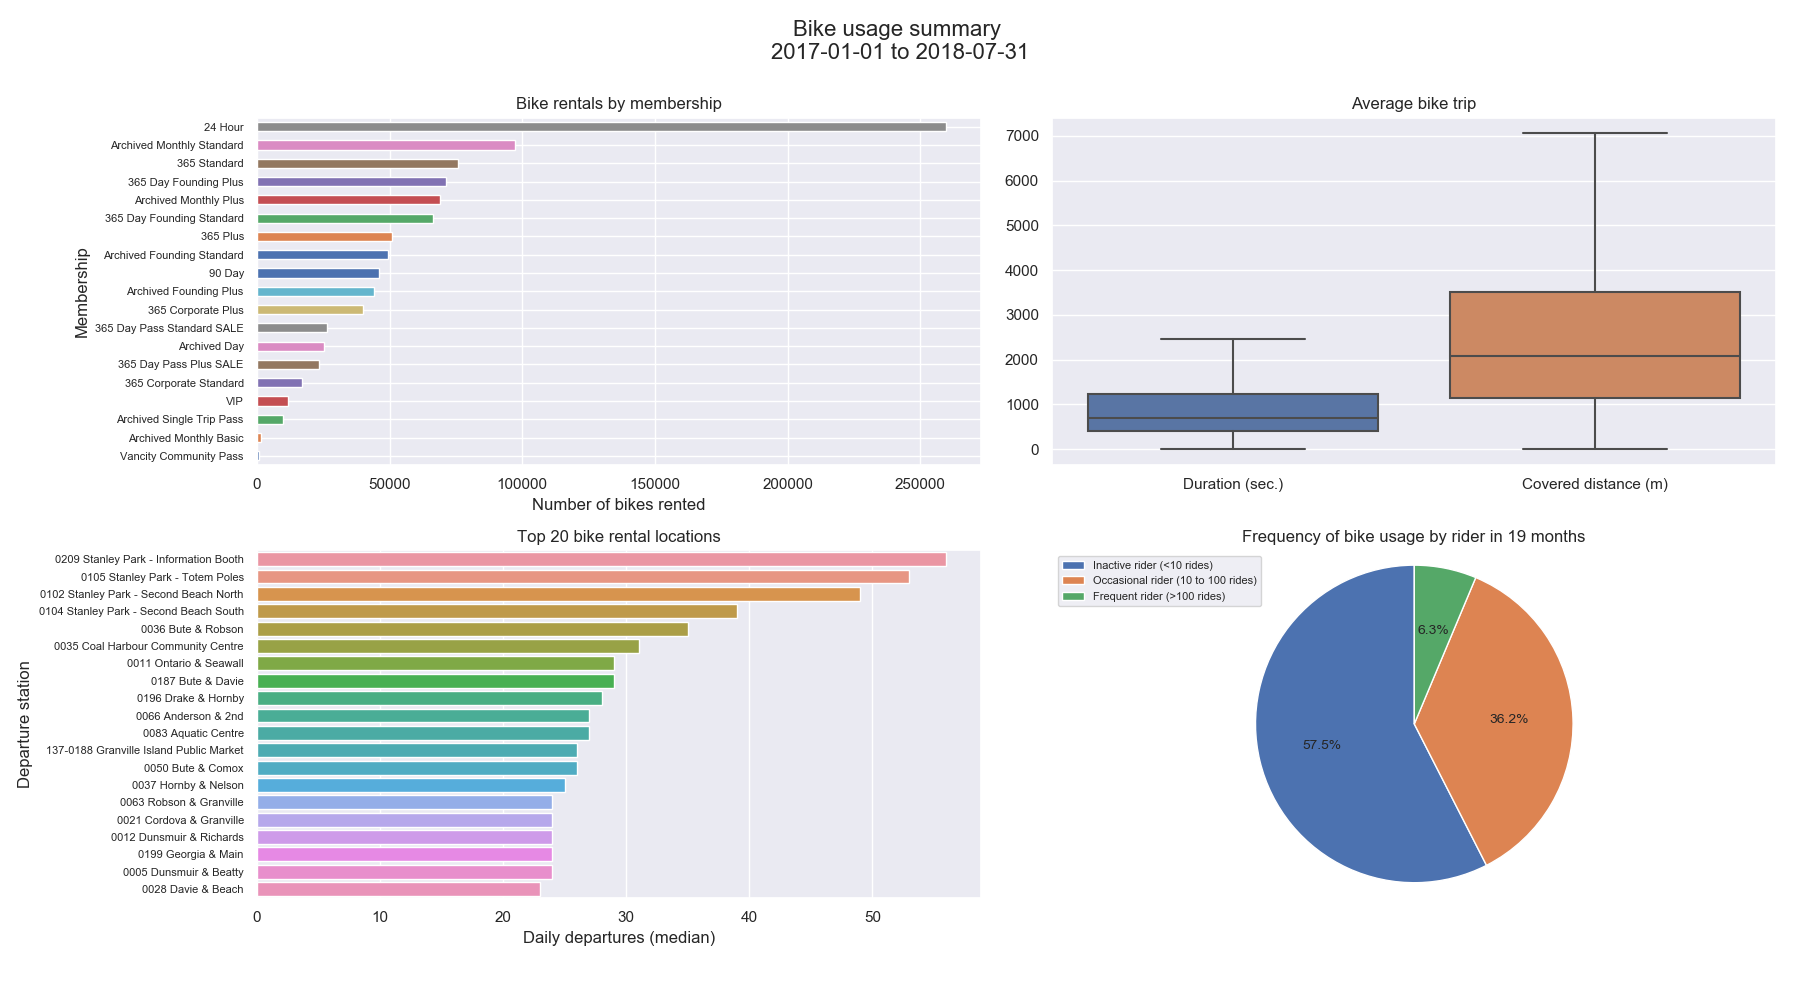
Some highlights of bike usage:
- Due to the changes of Membership, it is unclear how archived memberships are mapped to current. However, it is very clear that more than half of the bike rentals were from the “24 Hour” group, which allows access to bikes in 24 hours. This is also confirmed by the frequency of bike usage in the pie chart. Inactive riders (rented bikes less than 10 times over 19 months) account 57.5% of all riders, while frequent riders (bike used more than 100 times over 19 months) takes 6.3%. Would it be possible to launch marketing campaigns or sales initiatives to convert more 24 Hour bikers to frequent bikers?
- Most bike trips took from 7 to 20 minutes, and covered 1.2 km to 3.5 km.
- Many locations in the top 20 bike stations are popular tourist attractions. Stations in Stanley Park, a famous landmark in downtown Vancouver, have takes the first 4 spots.
Bike usage trends
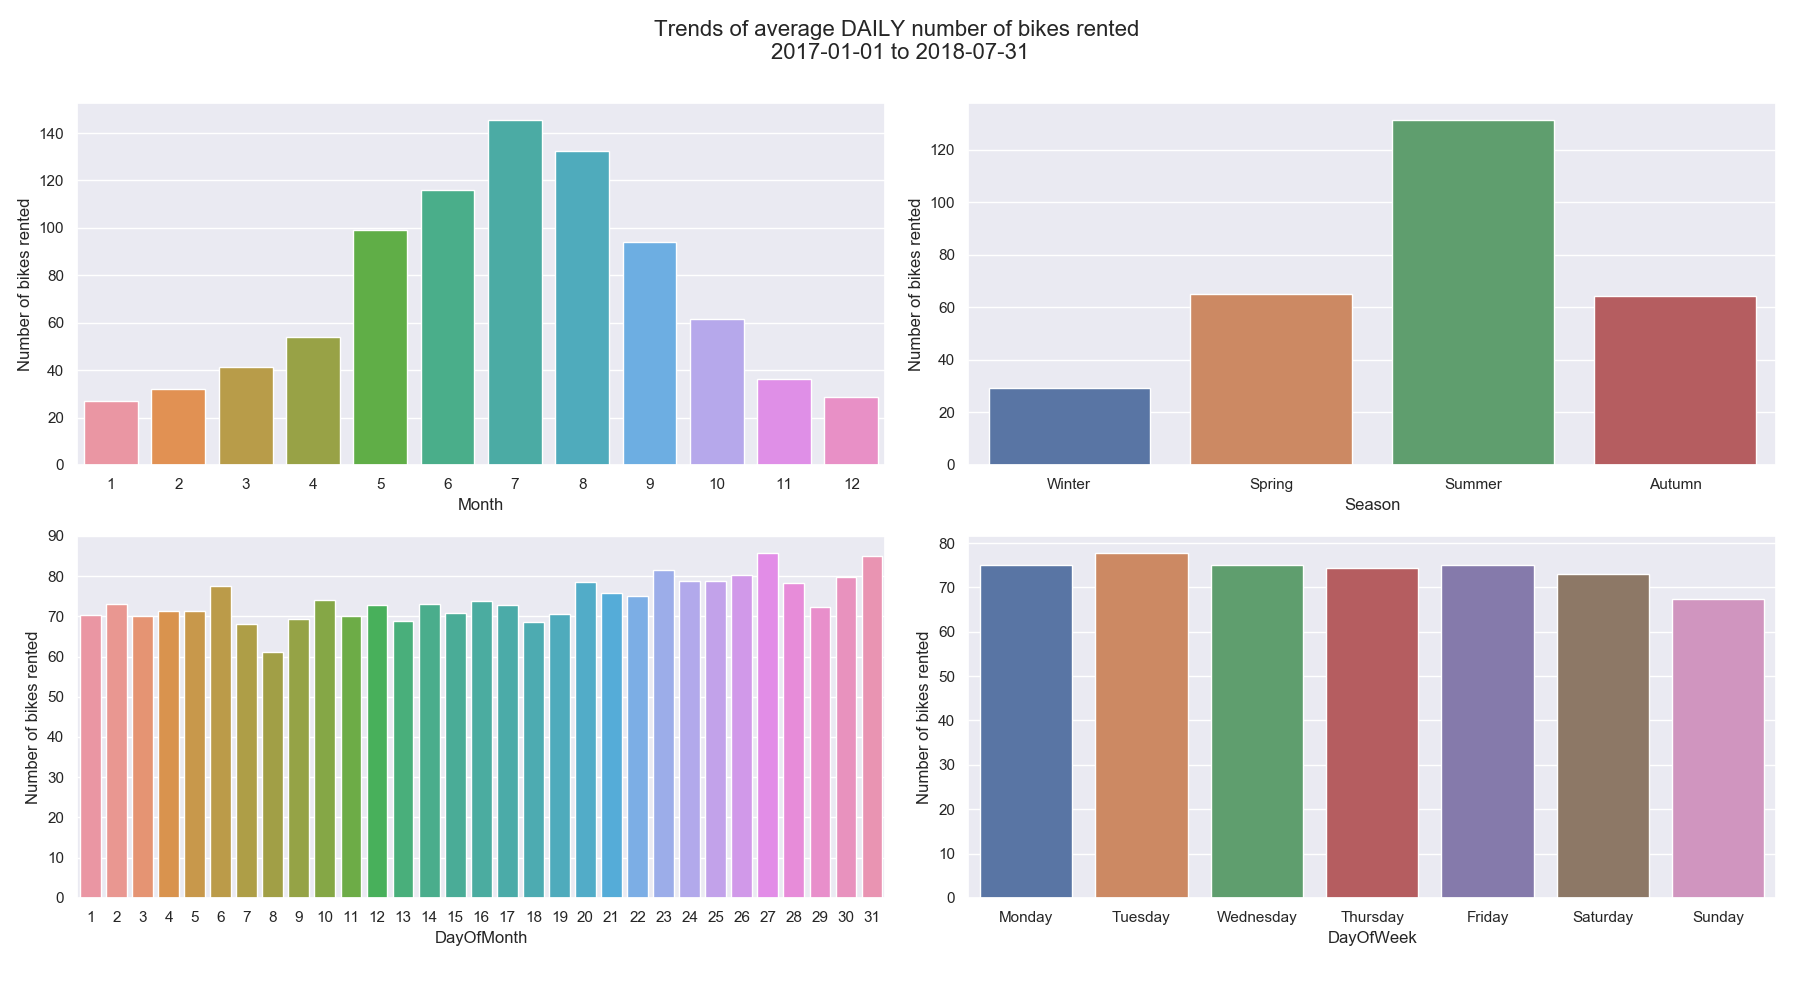
Some time-related trends on bike usage:
- Without surprise, summer is the best season to bike around in the city.
- During each month and week, there is no clear evidence that shows any preferences for bike rentals. I am a little surprised that weekends seem to have a little fewer bikers than weekdays, as you would think people like to ride bikes on weekends.
Correlation with others
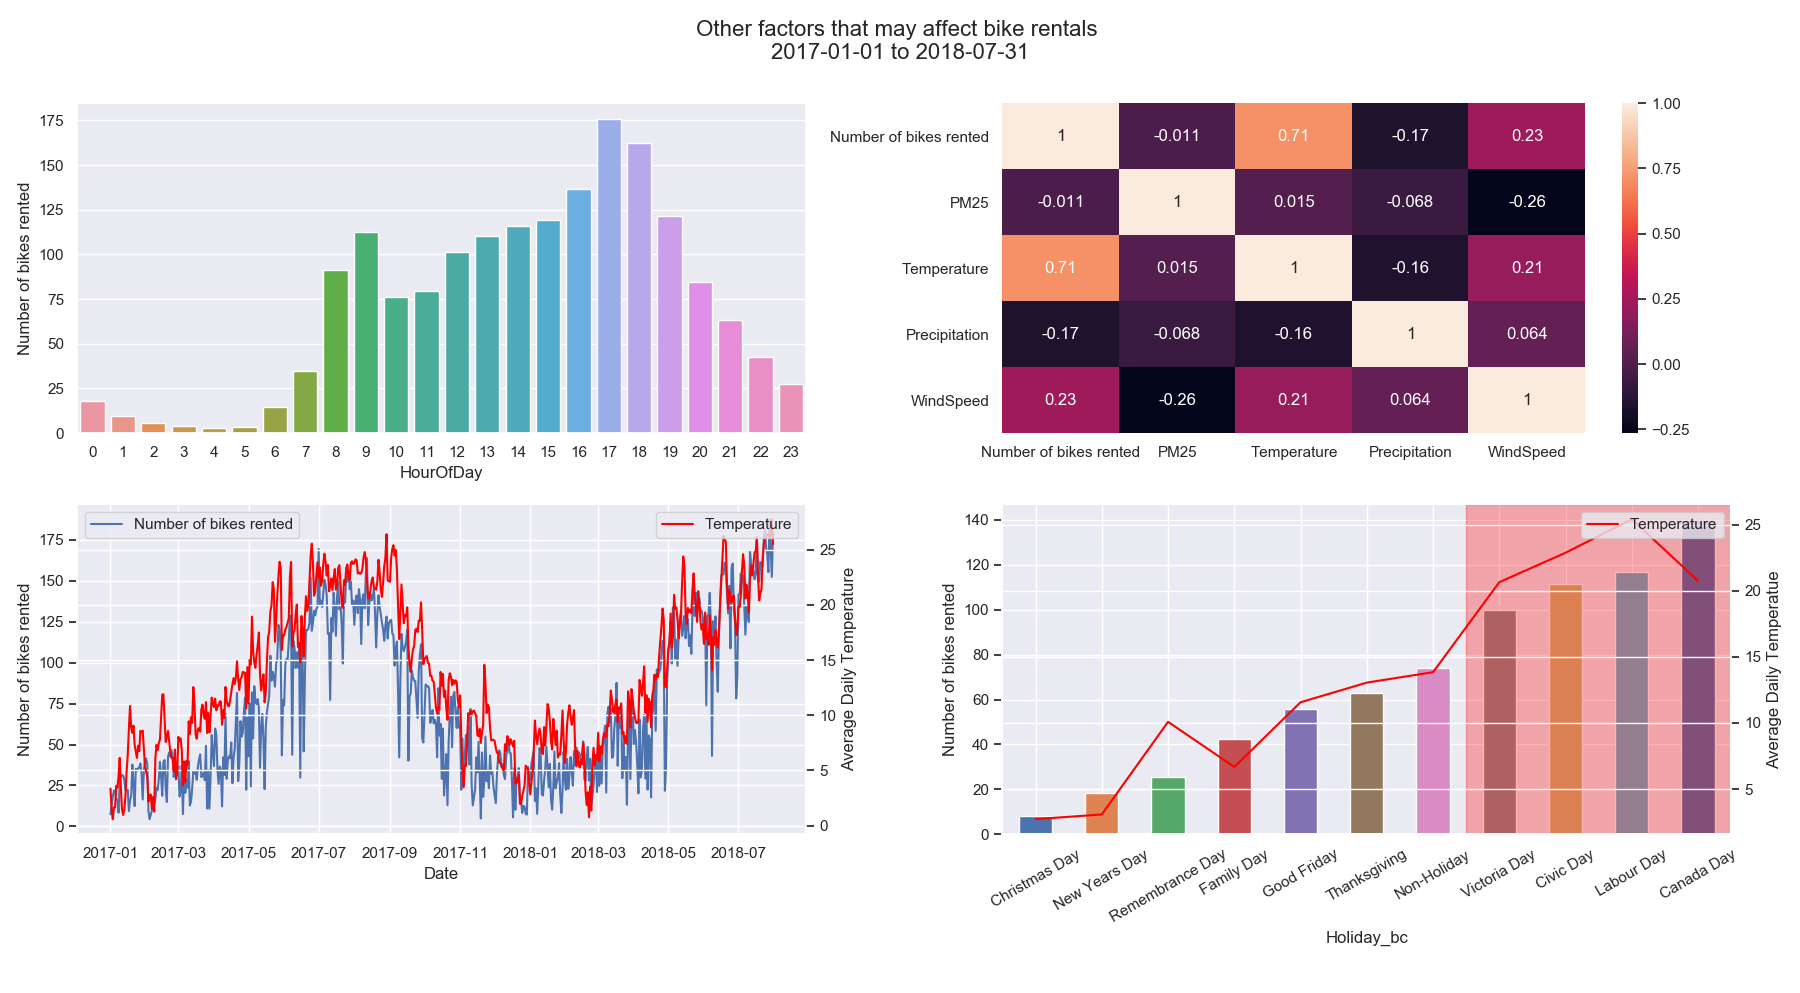
How other factors may affect bike rentals?
- Hour of day. It seems the early evening hours have the greatest demand for bike shares. Could it be an indication of riding bikes for social activities? Like going to restaurants, hanging out with friends, going to gyms, etc.
- Holidays. Out of 10 BC statutory holidays, only 4 had more bike rides than a normal day average. Not surprisingly, all 4 had above-average day temperature.
- Temperature. The line plot of daily bike rentals and temperature clearly shows temperature has a big impact on riding bikes. The correlation of the two (from the heatmap) is 0.71, a strong positive correlation (1.0 for perfect correlation and 0.0 means no correlation).
- Precipitation. The correlation value is -0.17, meaning precipitation slightly and negatively impacts riding bikes. It is understandable that no one likes to bike in a rain or snow. But, this is Vancouver (or Raincouver). People do not mind a little rain and they would still bike, run, and play outside. So, rain negatively affects bike riding but not so significantly.
- PM2.5 (air quality). In general air quality is excellent in the city. There are days that we had hazy skies due to crazy inland wildfires, but very few. So, the heatmap does not show any correlationship of PM2.5 with bike ride.
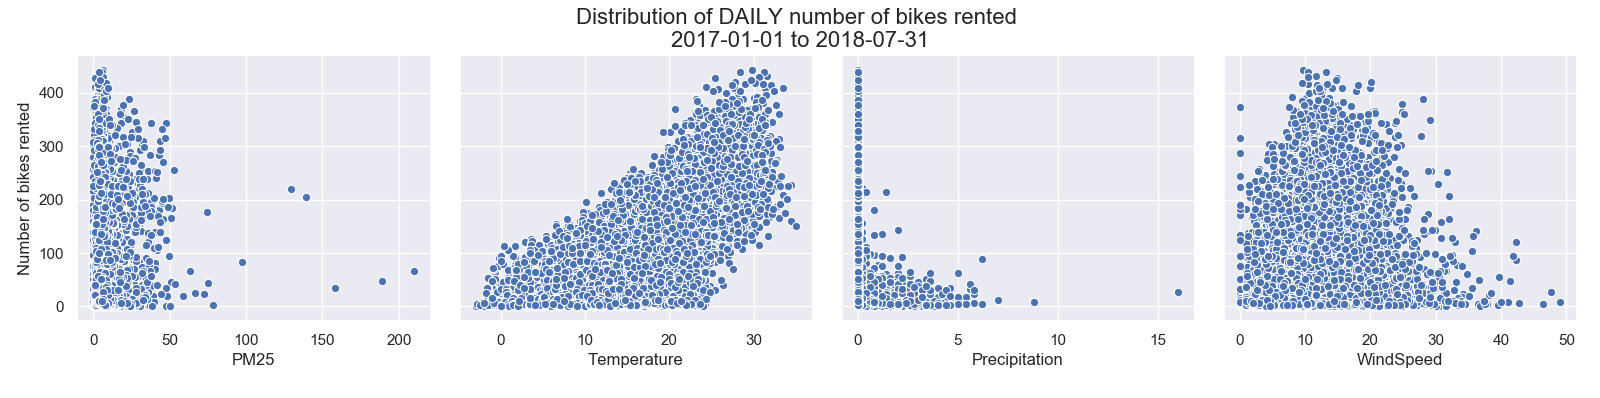
- Wind. This is an interesting one. Correlation is 0.23, a slight positive number, meaning stronger the wind more people ride bikes. How is that possible? From the last pairplot below, it is not hard to see that wind speed in most days is between 10 to 20 km/h. To most bike riders, it really does not matter that it is 5, or 10, or 20 km/h and we still bike! Because of the wind speed distribution, we are “tricked” to think there is a positive correlation of wind and bike ride. Therefore wind is dropped from feature set.
In the next post, I will build predictive models to forecast bike rentals. Stay tuned!
Happy Machine Learning!