This is Part 2 of building predictive models on Vancouver bike share. Part 1 is here. Python code can be found on my GitHub.
Model Training
Training dataset contains hourly bike rentals for each day from 01/01/2017 to 07/24/2018.
Two decision tree models were trained: Random Forest (RF) and Gradient Boosted Trees (GBM). They are well known for delivering better performance and efficiency on noisy datasets. However, tuning hyperparameters can be some challenges so that they will not overfit.
Randomized searches were performed to find the optimal hyperparameters values. Here are the hyperparameters and their candidate values in the search.
rf_parameters = {'n_estimators':[60, 80, 100],
                 'min_samples_leaf':[1, 2, 3],
                 'max_depth':[8, 10, 12],
                 'min_impurity_decrease':[0.0],
                 'min_samples_split':[2]}

xgb_parameters = {'objective': ['reg:linear'],
                  'n_estimators': [60, 80, 100],
                  'learning_rate': [0.01, 0.01, 0.1, 1],
                  'gamma': [0.01, 0.2, 1.0],
                  'reg_lambda': [0.01, 0.5, 0.1],
                  'max_depth': [5,7,9], # Max depth of tree. Deeper -> overfitting
                  'subsample': [0.5, 0.6, 0.7], # Subsample ratio of training instances
                  'colsample_bytree': [0.6, 0.7, 0.8], # Subsample ratio of columns of each tree
                  'silent': [0] # Printing running msg
                  }
Here are the optimal hyperparameters:
Best parameters for RF model: {‘n_estimators’: 100, ‘min_samples_split’: 2, ‘min_samples_leaf’: 2, ‘min_impurity_decrease’: 0.0, ‘max_depth’: 12}
Best parameters for GBM model: {‘subsample’: 0.5, ‘silent’: 0, ‘reg_lambda’: 0.1, ‘objective’: ‘reg:linear’, ‘n_estimators’: 100, ‘max_depth’: 7, ‘learning_rate’: 0.1, ‘gamma’: 0.01, ‘colsample_bytree’: 0.8}
Evaluation on Test
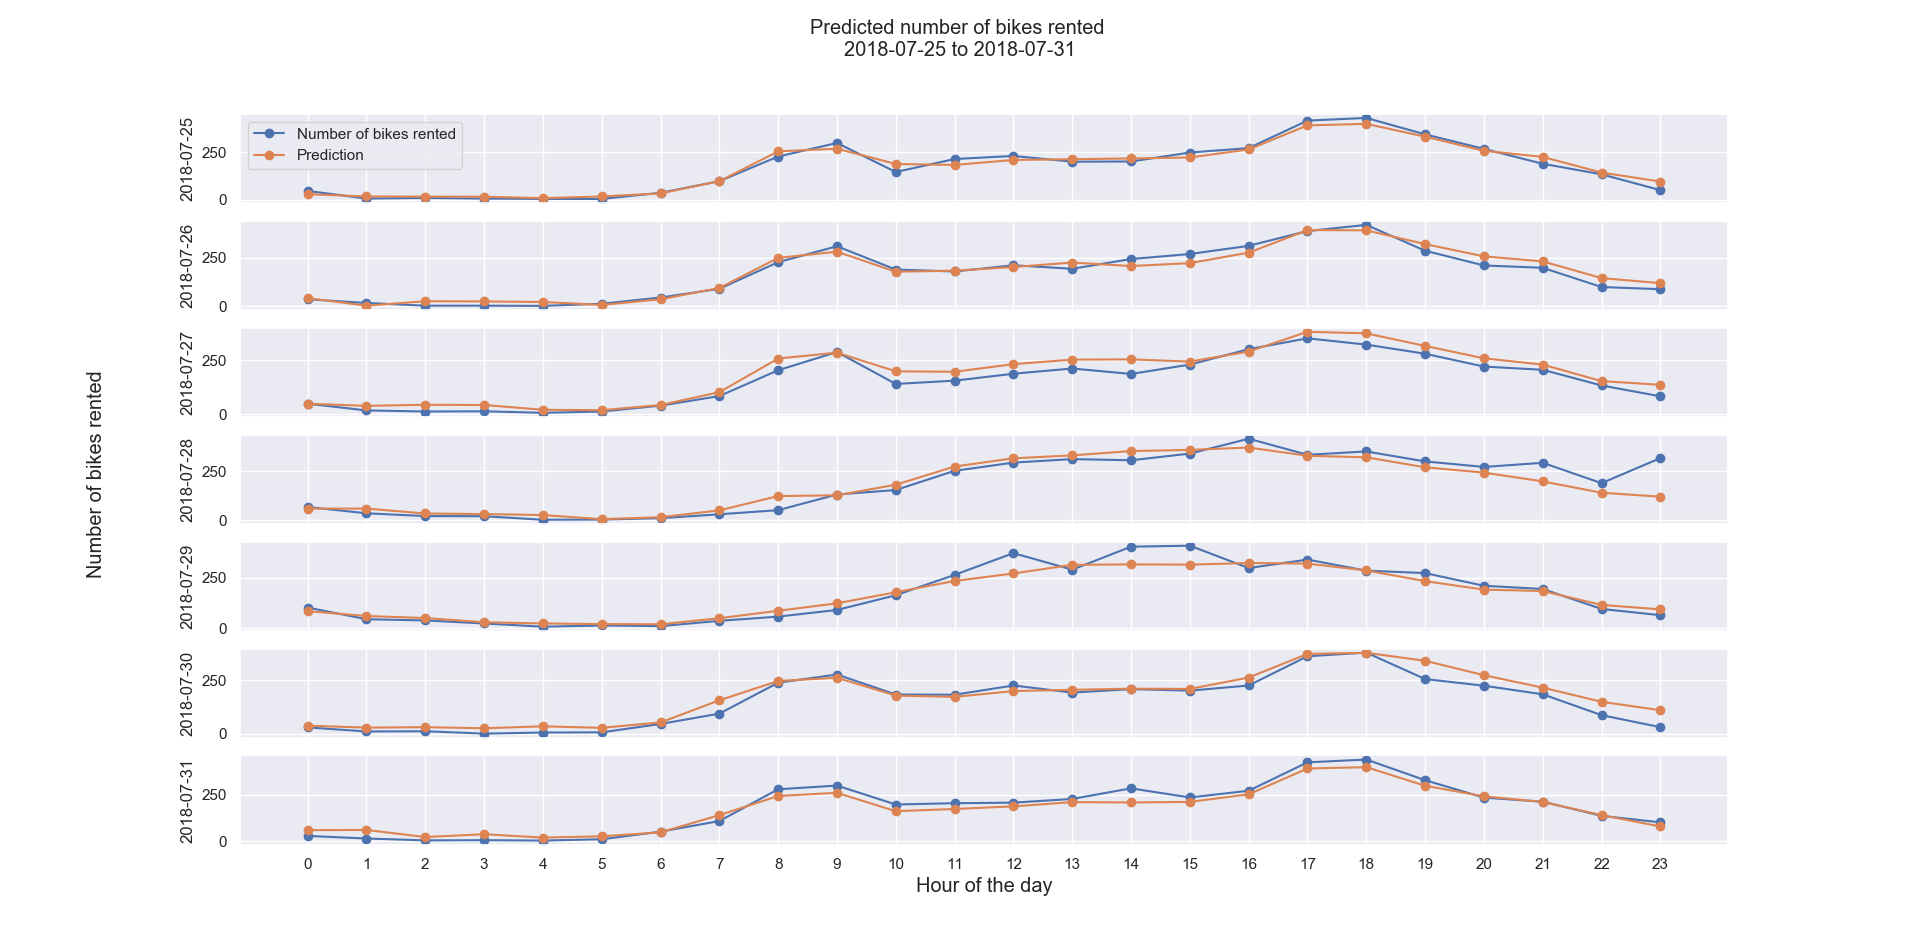
Test is done on hourly bike rentals from 07/25/2018 to 07/31/2018. Graph below shows our predictions are very close to real number of bikes rented. YAY!!
Model performance is measured on R2 score and RMSE (Root Mean Square Error). R-squared measures how close the data are to fitted regression/model, with 0.0 for no good and 1.0 for perfect fit. In general, the higher the R-squared, the better the model fits the data. RMSE measures the differences/errors between estimated and true values.
Below are the results. RF and GBM delivered similar accuracy, and GBM appears marginally better.
| R2 Score | RMSE | |
| RF | 0.918504 | 35.99281 |
| GBM | 0.919839 | 35.69664 |

Top 5 most important features:
- Temperature
- Hour of day
- Day of month
- Day of week
- Month
Future Work
- Could explore Vancouver tourism stats and use as feature
- Could use special public events in downtown Vancouver as feature
Again, this is Part 2 of building predictive models on Vancouver bike share. Part 1 is here. Python code can be found on my GitHub.
Happy Machine Learning!