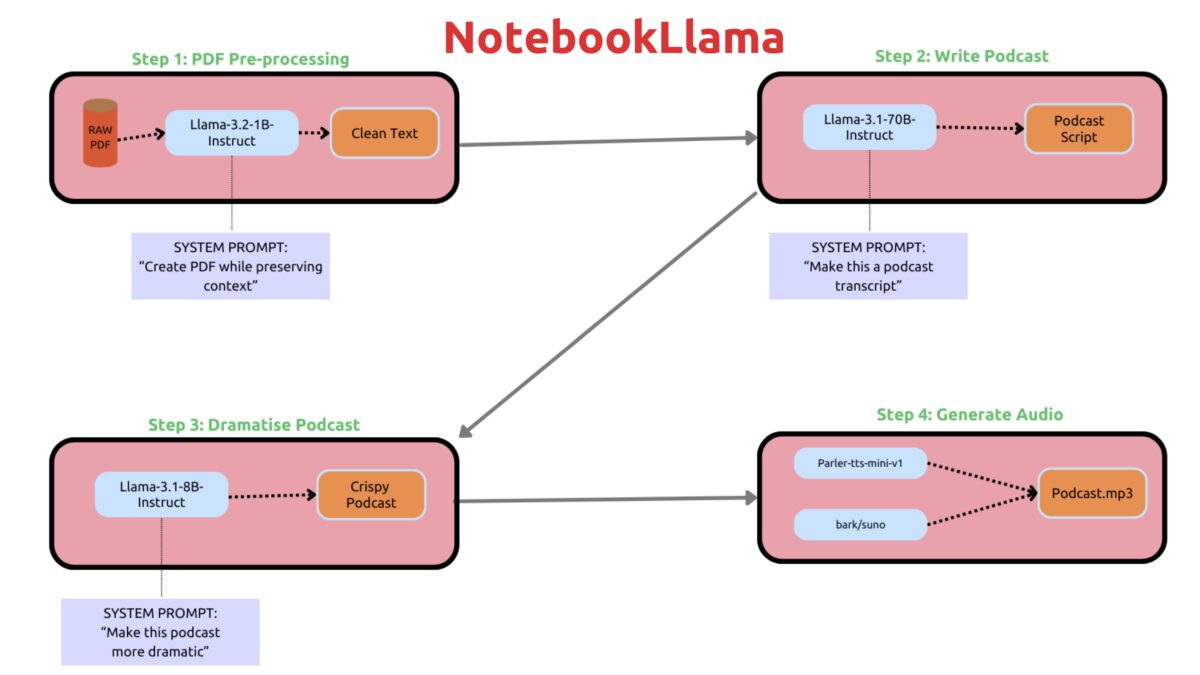
NotebookLlama, an open source version of Google NotebookLM deploys Meta’s Llama recipe for NotebookLM on the Llama family of models. Previously I used the NotebookLM to generate a podcast. I decided to build it from scratch using NotebookLlama workflow to generate a podcast from webpage content.
Workflow:
Read webpage content.
Transcript Writer: Use Llama-3.1-8B-Instruct model to write a podcast transcript from the text
Dramatic Re-Writer: Use Llama-3.1-8B-Instruct model to make the transcript more dramatic
Text-To-Speech: Use parler-tts/parler-tts-mini-v1 and bark/suno to generate a conversational podcast
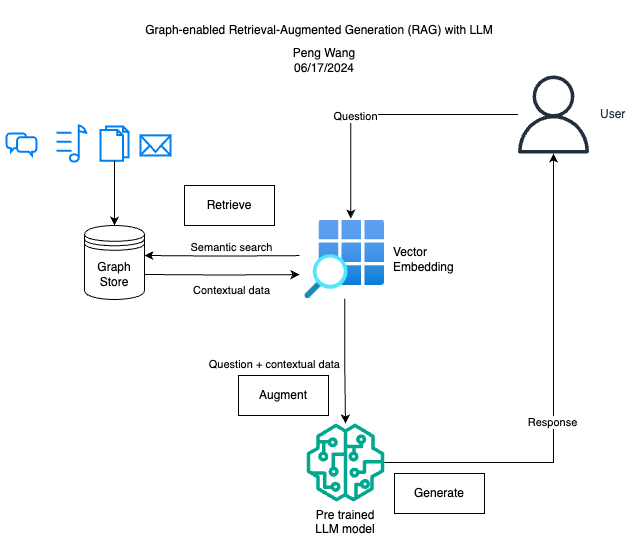
Previously I built a LLM chatbot with PDF documents, using the Retrieval Augmented Generation (RAG) technique. Traditional RAG leverages vector database and search retrieval methods, which measure the similarity or relatedness between different entities (such as words or phrases) based on their high-dimensional vector representations, typically the cosine similarity. For example, in a vector representation, the word “employee” may be more related to “employer” than “hired”, as it appears closer in the vector space.
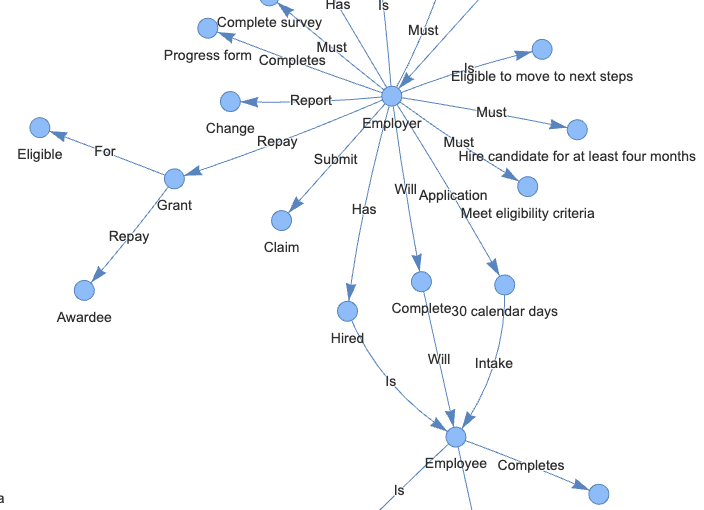
One of the the problems with the vector database is that it ignores the structure and relationship of entities. We can manage this challenge by introducing Knowledge Graph, a data structure that organizes data as nodes and edges enhancing the contextuality of retrieved information.
A knowledge graph consists Subject-Predicate-Object triplets, where subjects/objects are represented by the nodes and predicates/relationships are represented by the edges. For example, in this triplet “employer – submit – claim”, “submit” is the predicate and indicates the relationship between “employer” and “claim”. By triplet representation, a knowledge graph database can make complex data search more accurate and efficient.
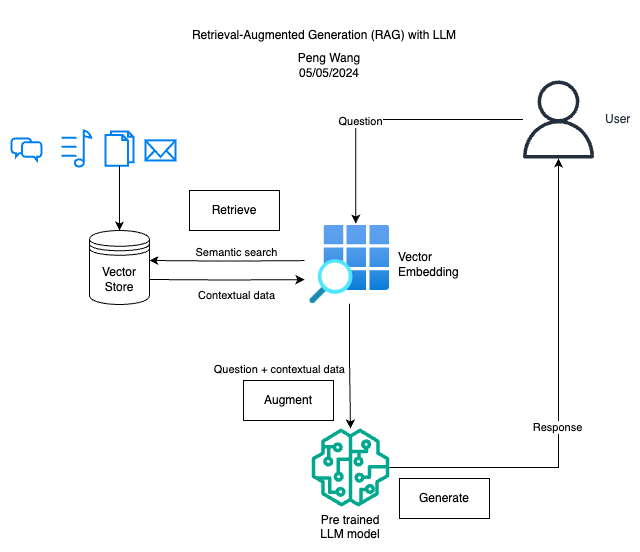
Have you applied for loans, grants, or financial assistance programs? Have you dedicated significant time to deciphering legal or contractual documents to understand regulations and rules? Are you looking to streamline the process of reviewing extensive requirement documents? Your solution is here. I have developed an LLM chatbot, supported by RAG, to provide prompt responses to user inquiries based on the content of provided PDF documents.
Retrieval Augmented Generation (RAG) involves enhancing Large Language Models (LLMs) with additional information from custom external data sources. This approach improves the LLM’s understanding by providing context from retrieved data or documents, enhancing its ability to respond to user queries with domain-specific knowledge.
Retrieve: User queries are used to fetch relevant context from an external knowledge source. The queries are embedded into a vector space along with the additional context, allowing for a similarity search. The top k closest data objects from the vector database are then returned.
Augment: The user query and retrieved additional context are combined into a prompt template.
Generate: The retrieval-augmented prompt is then input into the LLM for final processing.
In my experiment, I utilized PDF documents as the external knowledge source. Users can ask questions or make queries based on the context provided in these documents. I employed the HuggingFace model sentence-transformers/multi-qa-MiniLM-L6-cos-v1 for vector embedding and the pre-trained LLM model meta-llama/Llama-2-7b-chat-hf for generating the final results.
People often ask me what skills needed to become a data engineer. Before answering that question, let’s take a look at what data engineer do. According to Coursera
Data engineering is the practice designing and building systems for collecting, storing, and analyzing data at scale.
Data engineering has become the backbone of many applications across industries, and data engineer is an indispensable asset for many organizations.
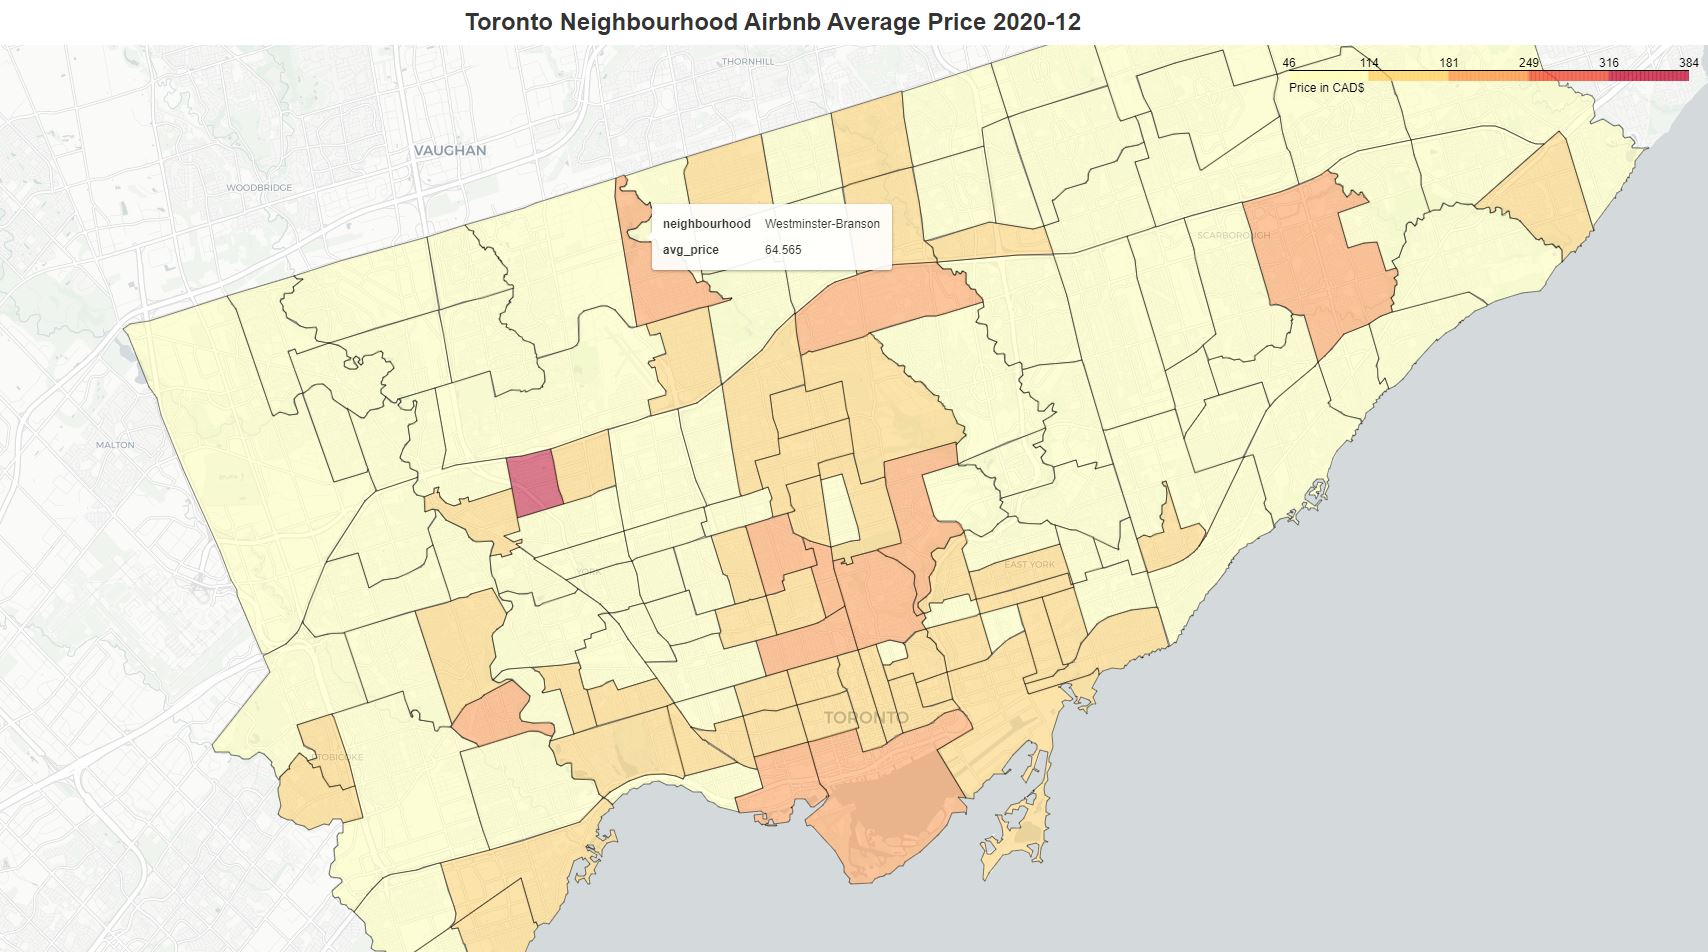
I like using data to answer questions. I extracted 550 United States data engineer jobs from indeed.com and did some quick analyses using job description, location, and salary range. Although sample size is not big, it should be sufficient to reveal some insights and trends.
In exploratory data analysis (EDA), we often calculate correlation coefficients and present the result in a heatmap. Correlation coefficient measures the statistical relationship between two variables. The correlation value represents how the change in one parameter would impact the other, e.g. quantity of purchase vs price. Correlation analysis is a very important concept in the field of predictive analytics before building the model.
But how do we measure statistical relationship in a spatial dataset with geo locations? The conventional EDA and correlation analysis ignores the location features and treats geo coordinates similar to other regular features. Exploratory Spatial Data Analysis (ESDA) becomes very useful in the analysis of location-based data.
Spatial Autocorrelation
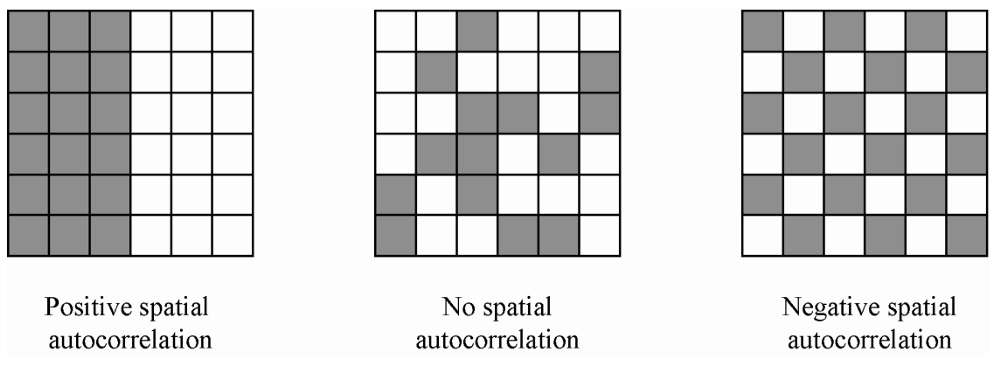
ESDA is intended to complement geovizualization through formal statistical tests for spatial clustering, and Spatial Autocorrelation is one of the important goals of those tests. Spatial autocorrelation measures the correlation of a variable across space i.e. relationships to neighbors on a graph. Values can be
positive: nearby cases are similar or clustered e.g. High-High or Low-Low (left image on the figure below)
neutral: neighbor cases have no particular relationship or random, absence of pattern (center image on the figure below)
negative: nearby cases are dissimilar or dispersed e.g. High-Low or Low-High (right image on the figure below)
Illustrations of spatial autocorrelation. From (Radil, 2011).
Predicting someone’s demographic attributes based on limited amount of information available is always a hot topic. It is common to use people’s name, ethnicity, location, and pictures for training models that can tell gender. Can you actually guess someone’s gender only based on what they share on Twitter? We will explore this using NLP techniques in this article.
At the end we conclude that it is quite a challenge to predict someone’s gender only using a single tweet. However, by combining prediction results from many tweets of the same person (similar to ensemble techniques like bagging), we may reach much better performance.
For work reasons, I have opportunities to interact with HR analysts everyday. I am always curious what skills one would need to become an HR analyst.
Below is an HR Analyst job summary from SHRM.org. Other names for HR Analyst include People Analytics Analyst, Workforce Analytics Specialist, Data Analyst – People Analytics, etc.
The Human Resource (HR) Analyst will collect, compile, and analyze HR data, metrics, and statistics, and apply this data to make recommendations related to recruitment, retention, and legal compliance.
To become an HR analyst, one needs to have the HR-related domain knowledge. This topic will be explored in another article. Here we will just focus on technical skills, general skills, and education.
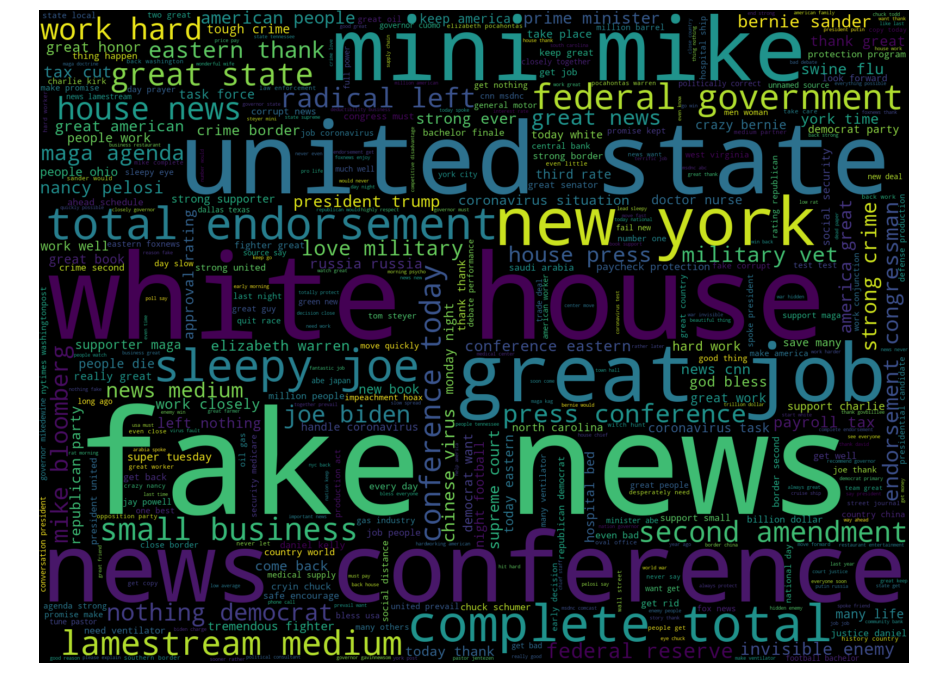
In our last post, we extract @realDonalTrump and @JustinTrudeau tweets, clean up the texts, and generate word clouds. In this article, we will build a Latent Dirichlet Allocation (LDA) model to study the topics of the hundreds of tweets posted by the two world leaders.
Topic Modeling
Topic modeling is an unsupervised machine learning technique which is widely used for discovering abstract topics of a collection of documents. It considers each document to be represented by several topics and each topic to be represented by a set of words that frequently appear together. For example, with a cluster of cloud, rain, wind, we can tell that the associated topic likely related to weather.
During the COVID-19 pandemic, people take their worries, concerns, frustration, and loves to social media to share with the rest of the world about their feelings and thoughts. Twitter has become one of official channels where world leaders communicate with their supporters and followers. To understand what keep them busy, we extract tweets of two world leaders, Donald Trump (the President of United States) and Justin Trudeau (the Prime Minister of Canada). By applying natural language processing techniques and Latent Dirichlet Allocation (LDA) algorithm, topics of their tweets can be learned. So we can see what is on their mind during the crisis.
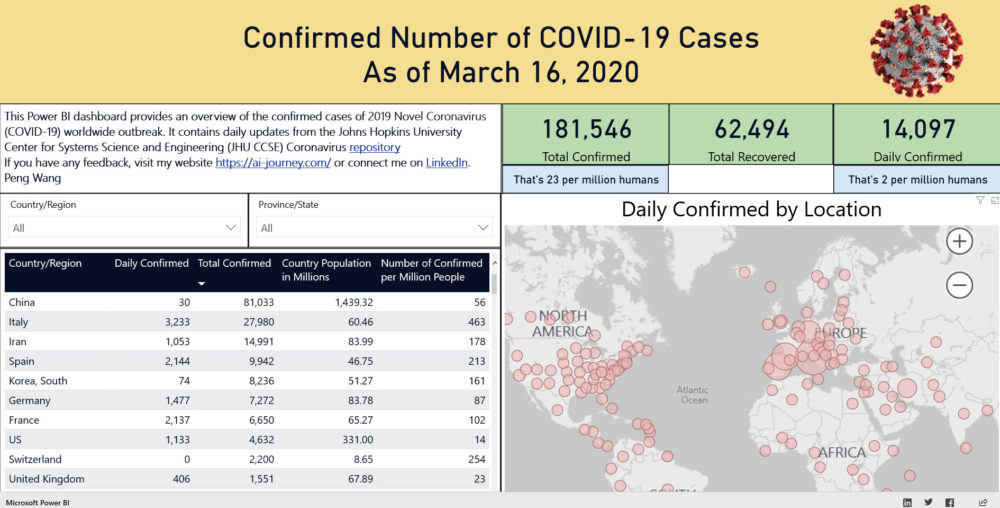
On March 11, the WHO declared the Novel Coronavirus outbreak a pandemic, a new disease that has spread around the world. Many countries have seen reported cases of the virus.
To help track and understand the daily spread of the virus, I built this Power BI dashboard. It provides an overview of the confirmed and recovered cases of COVID-19 worldwide outbreaks. It contains daily updates from the Johns Hopkins University Center for Systems Science and Engineering (JHU CCSE) Coronavirus repository.