On March 11, the WHO declared the Novel Coronavirus outbreak a pandemic, a new disease that has spread around the world. Many countries have seen reported cases of the virus.
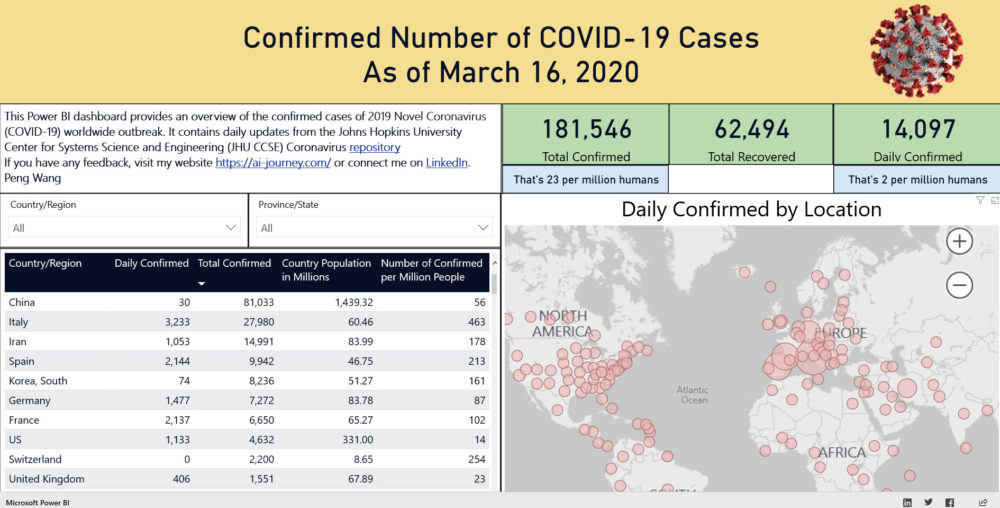
To help track and understand the daily spread of the virus, I built this Power BI dashboard. It provides an overview of the confirmed and recovered cases of COVID-19 worldwide outbreaks. It contains daily updates from the Johns Hopkins University Center for Systems Science and Engineering (JHU CCSE) Coronavirus repository.

Some of the measures to highlight:
- Number of Confirmed per Million Human: This puts the total number of confirmed Coronavirus cases in the context of a country’s population.
- Daily Confirmed China VS Rest of the World: The rest of the world can compare to Coronavirus initial outbreak in China and see where we are in terms of the overall curve.
- Number of Confirmed in Canada by Province