In exploratory data analysis (EDA), we often calculate correlation coefficients and present the result in a heatmap. Correlation coefficient measures the statistical relationship between two variables. The correlation value represents how the change in one parameter would impact the other, e.g. quantity of purchase vs price. Correlation analysis is a very important concept in the field of predictive analytics before building the model.
But how do we measure statistical relationship in a spatial dataset with geo locations? The conventional EDA and correlation analysis ignores the location features and treats geo coordinates similar to other regular features. Exploratory Spatial Data Analysis (ESDA) becomes very useful in the analysis of location-based data.
Spatial Autocorrelation
ESDA is intended to complement geovizualization through formal statistical tests for spatial clustering, and Spatial Autocorrelation is one of the important goals of those tests. Spatial autocorrelation measures the correlation of a variable across space i.e. relationships to neighbors on a graph. Values can be
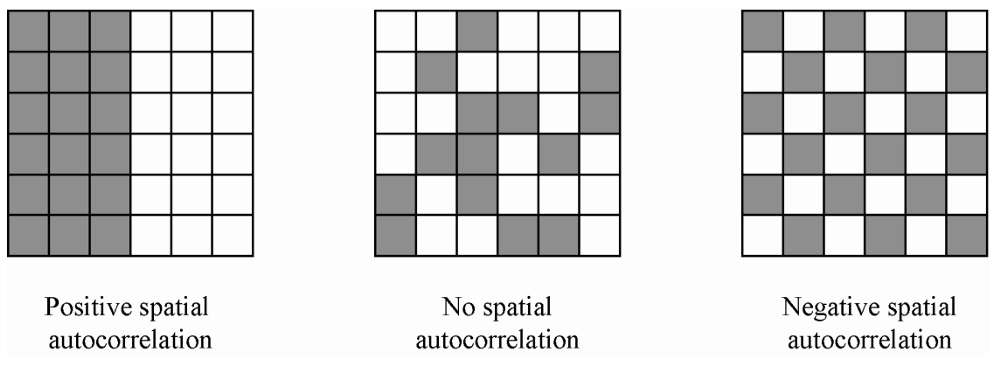
- positive: nearby cases are similar or clustered e.g. High-High or Low-Low (left image on the figure below)
- neutral: neighbor cases have no particular relationship or random, absence of pattern (center image on the figure below)
- negative: nearby cases are dissimilar or dispersed e.g. High-Low or Low-High (right image on the figure below)


